2.2: KQL and Filters
Objective:
In this lab, you will use KQL and filters to build queries on the web logs data set.
-
In Kibana, open the Discover interface by clicking on:
- > Analytics > Discover
-
Set your context to use the Kibana Sample Data Logs data view for the last 7 days. Your view should look like this:
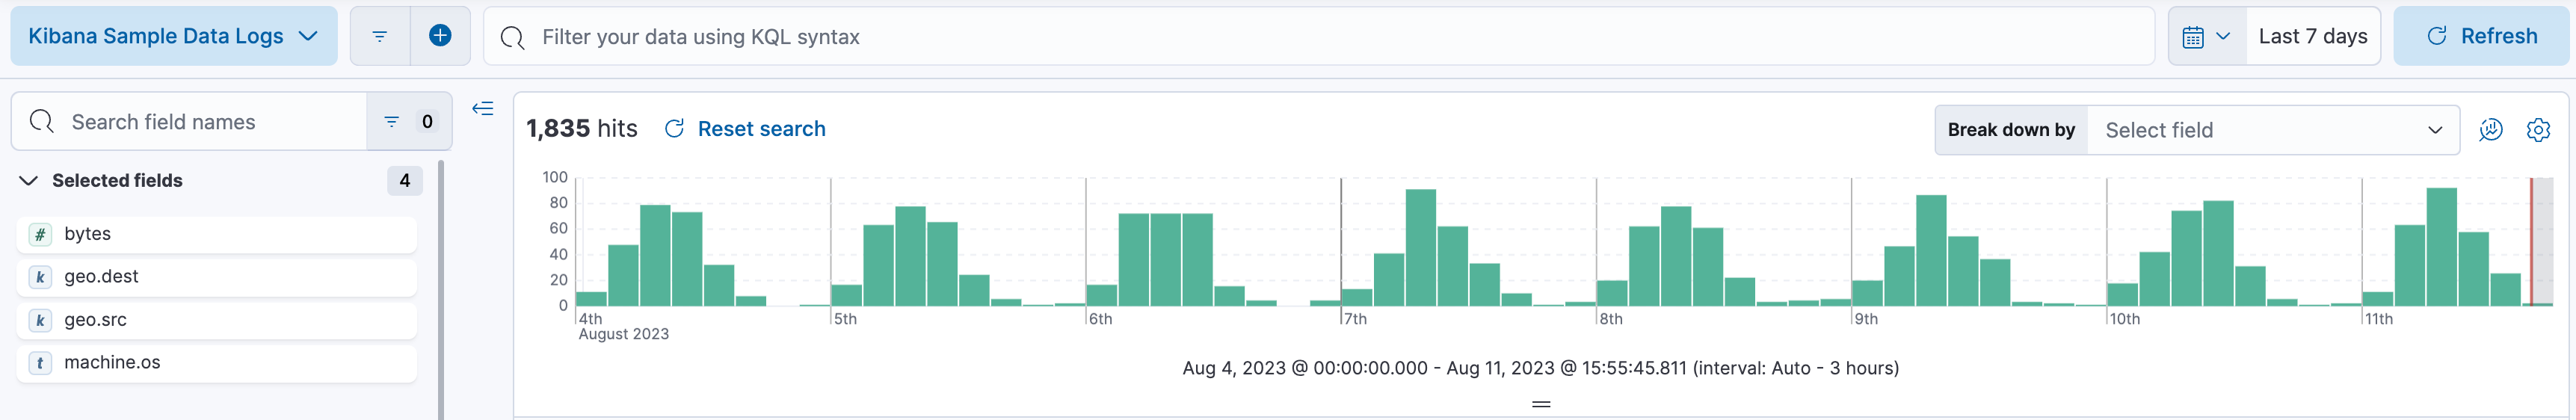 Note: you may already have this view from the previous lab.
 -
Your Document Table should be showing four columns:
Time (timestamp),bytes,geo.destandgeo.src. If not, add the columns to the view, as you did in the previous lab.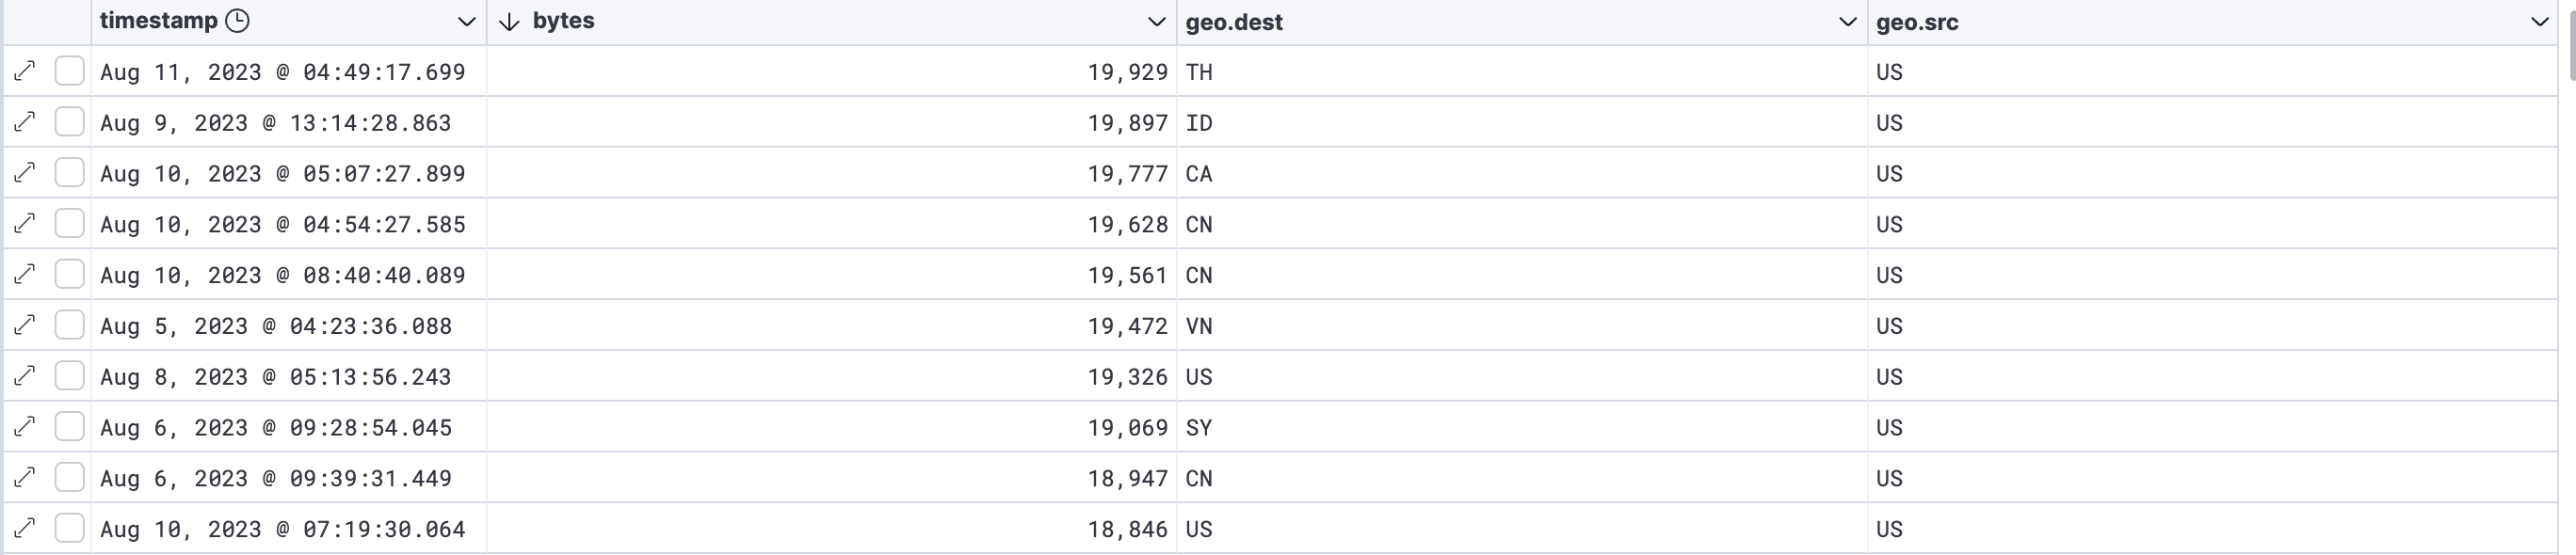
-
Let's do some searches. In the Query Bar enter the value US with no other details. Then click the Update button.

-
Scroll through your Document Table. Your query results will have US highlighted, but you will see highlights in both the
geo.destandgeo.srccolumns.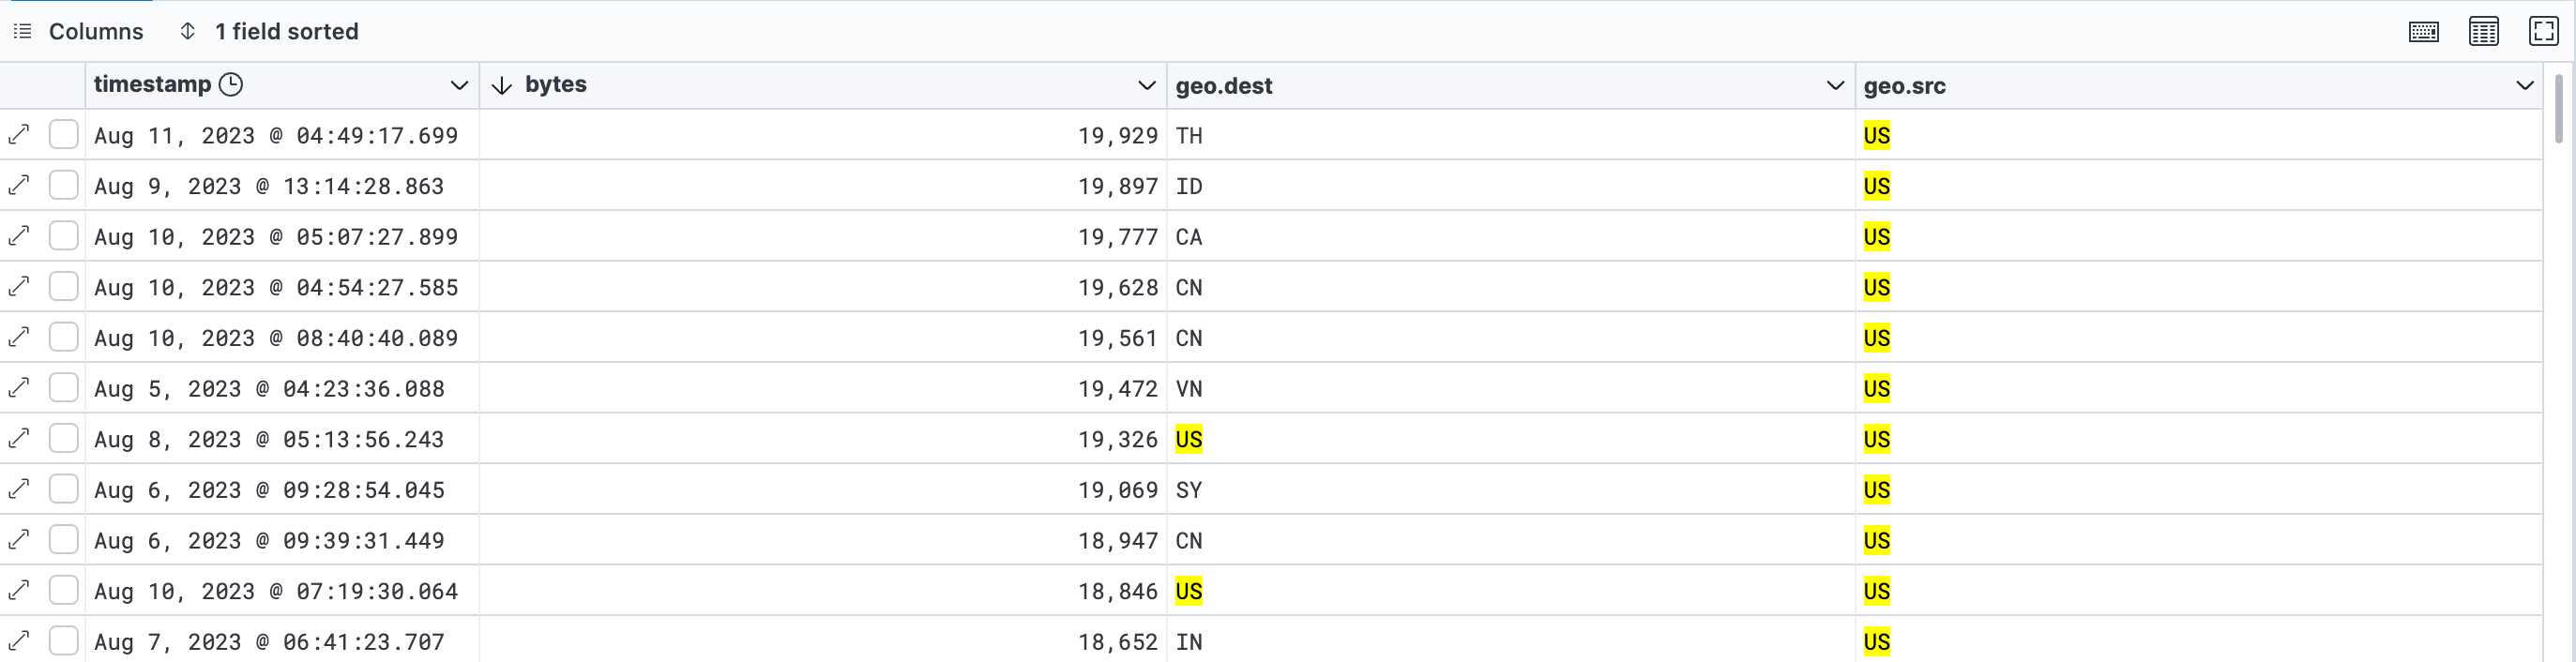
-
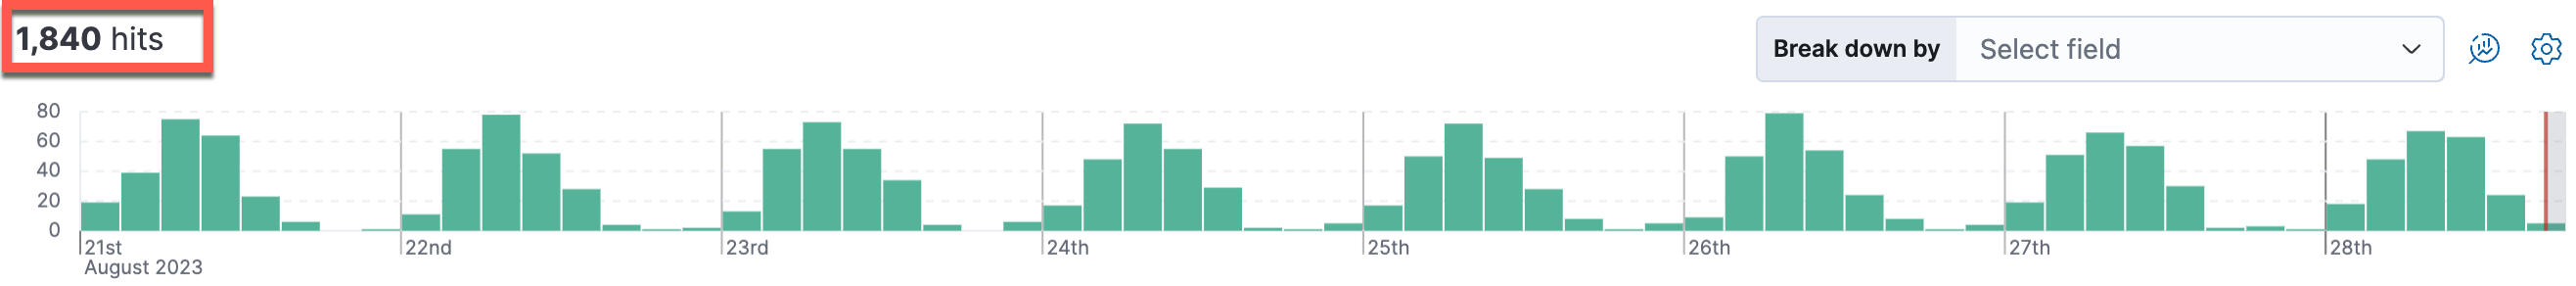
Edit your query to find entries where only the
geo.srcfield has the value US. Look at the Show answer panel for help. -
Did you notice anything with this query?
Show answer
The results with and without the
geo.src:USquery are the same, or have 1840 hits. This means that all of the values are US and we do not need to use this query. -
Remove the last query and create new a query to limit the entries to just those where more than 3,000 bytes have been sent with the
geo.destof CN. Notice that when you create this filter, it will further limit the number of results to a smaller value. Look at the Show answer panel for help. -
Modify the clause to find entries where the
responseis a value of 404. Notice that when you create this filter, it will further limit the number of results to a smaller value. Look at the Show answer panel for help. -
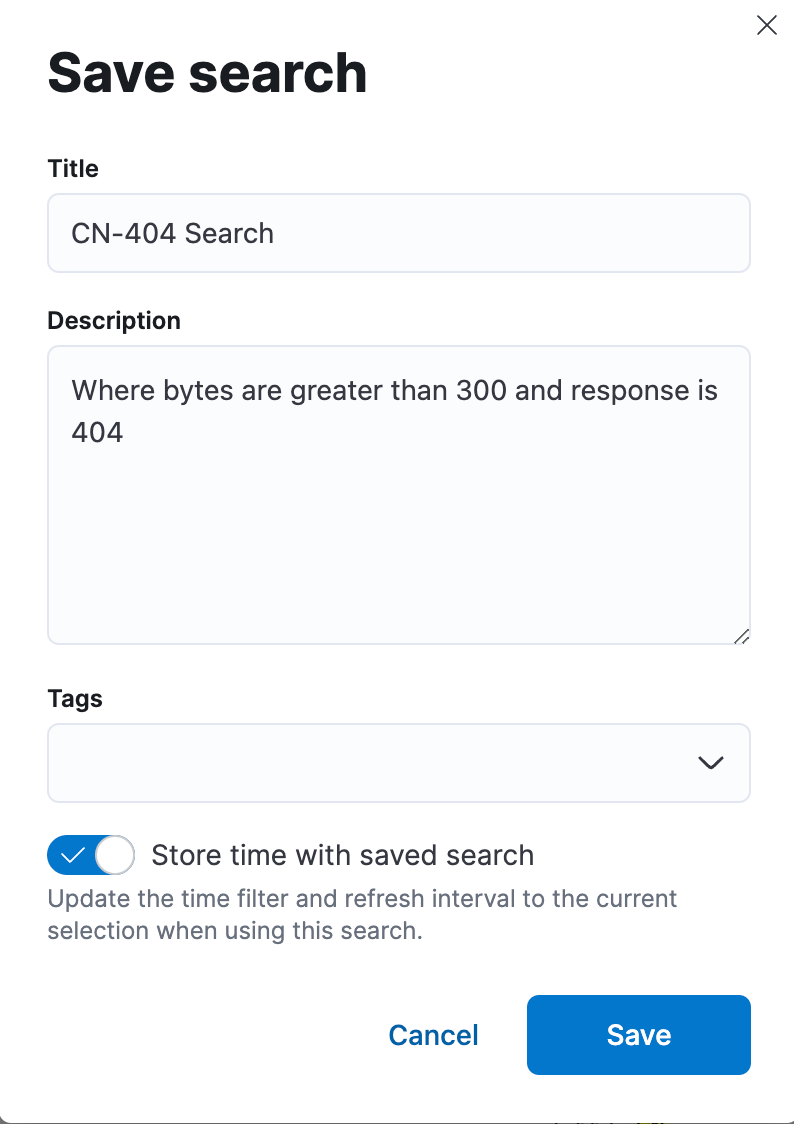
Let's save this search. In the upper right corner, click the Save link. In the dialog, name your search CN-404 Search. You can optionally enter a description. Select the Store time with saved search and then click the Save button.
-
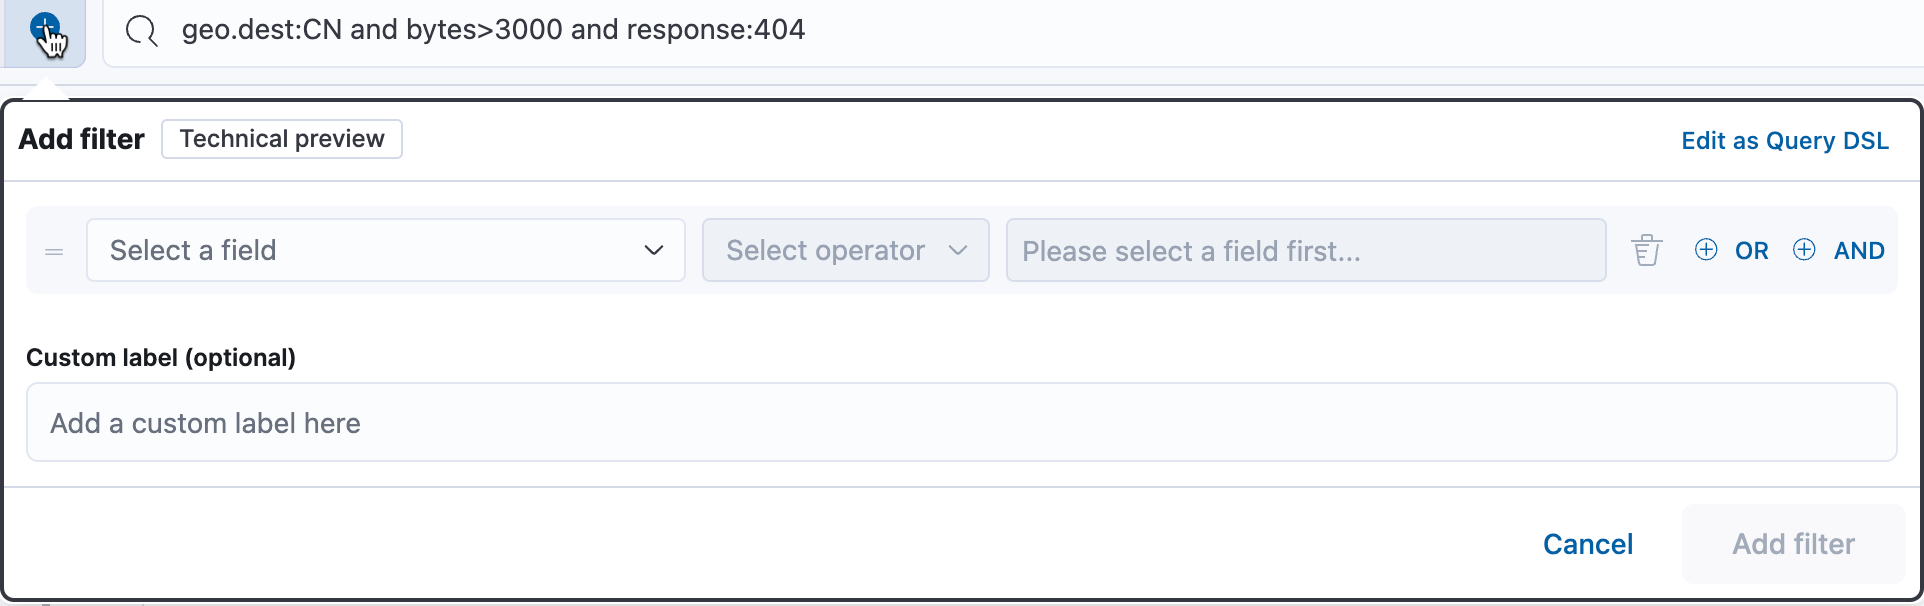
Let's turn these query clauses into filters. First, click the + button next to the Query Bar.
-
Select the field bytes from the dropdown, then choose the is between operator. Set the start of the range to 3000, but leave the end of the range blank. Add a custom label of bytes greater than or equal to 3000. Click Add filter.
-
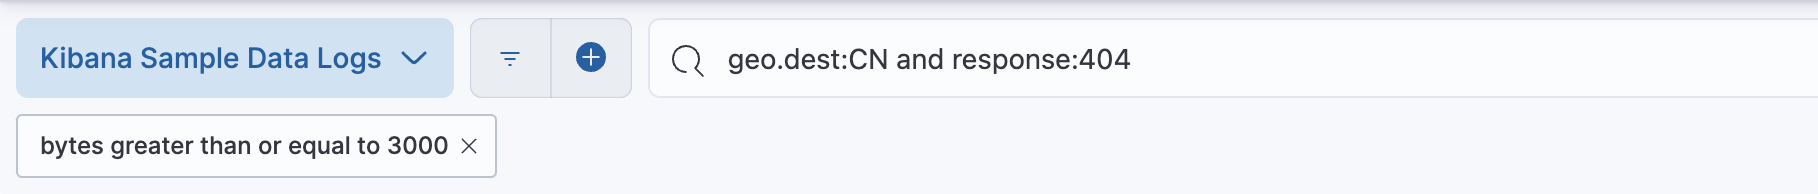
If you remove the query clause for bytes, you will now get the same number of results, but with a filter that can be toggled on and off easily.
-
Let's add a filter for the China as destination country. Instead of using the Filter menu, we can use Break down by to view the distribution of a field and then filter on specific value. First, remove the query clause
geo.dest:CNfrom the Query bar and click Update. Next, selectgeo.destfrom the dropdown list in Break down by to view the top desinations in the histogram.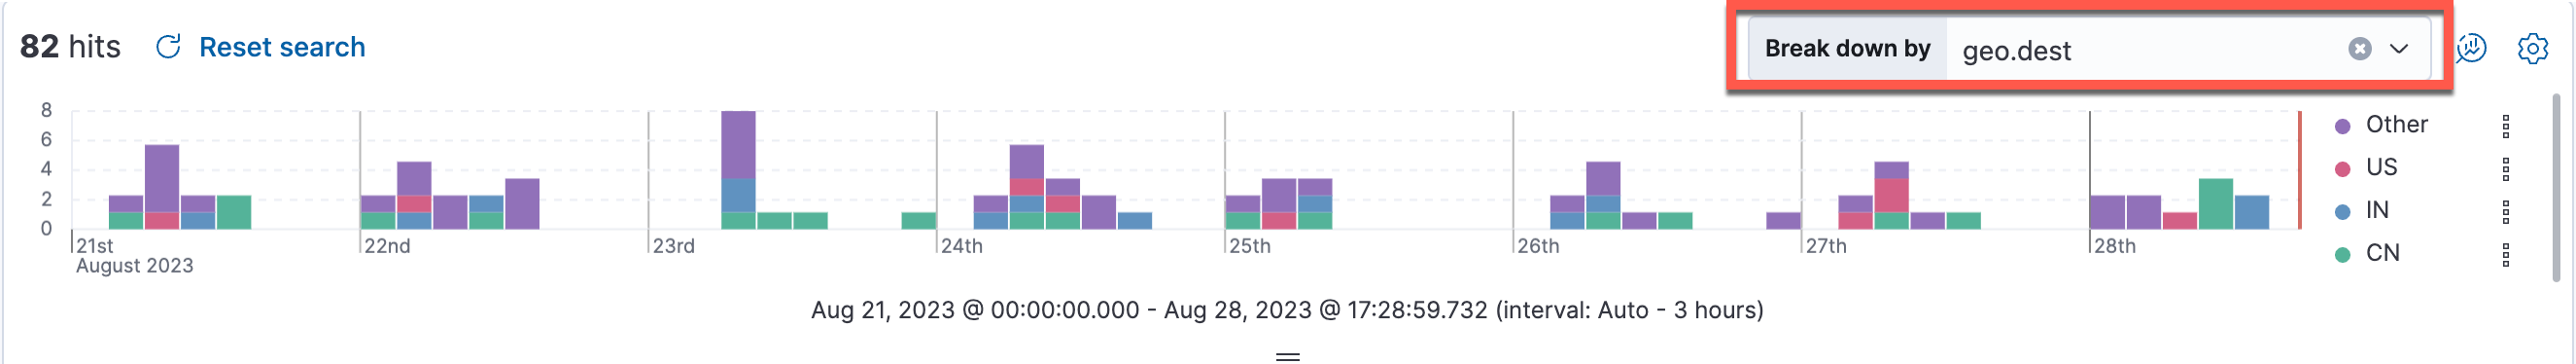 Click the CN filter option and select Filter for value to filter on
 CN.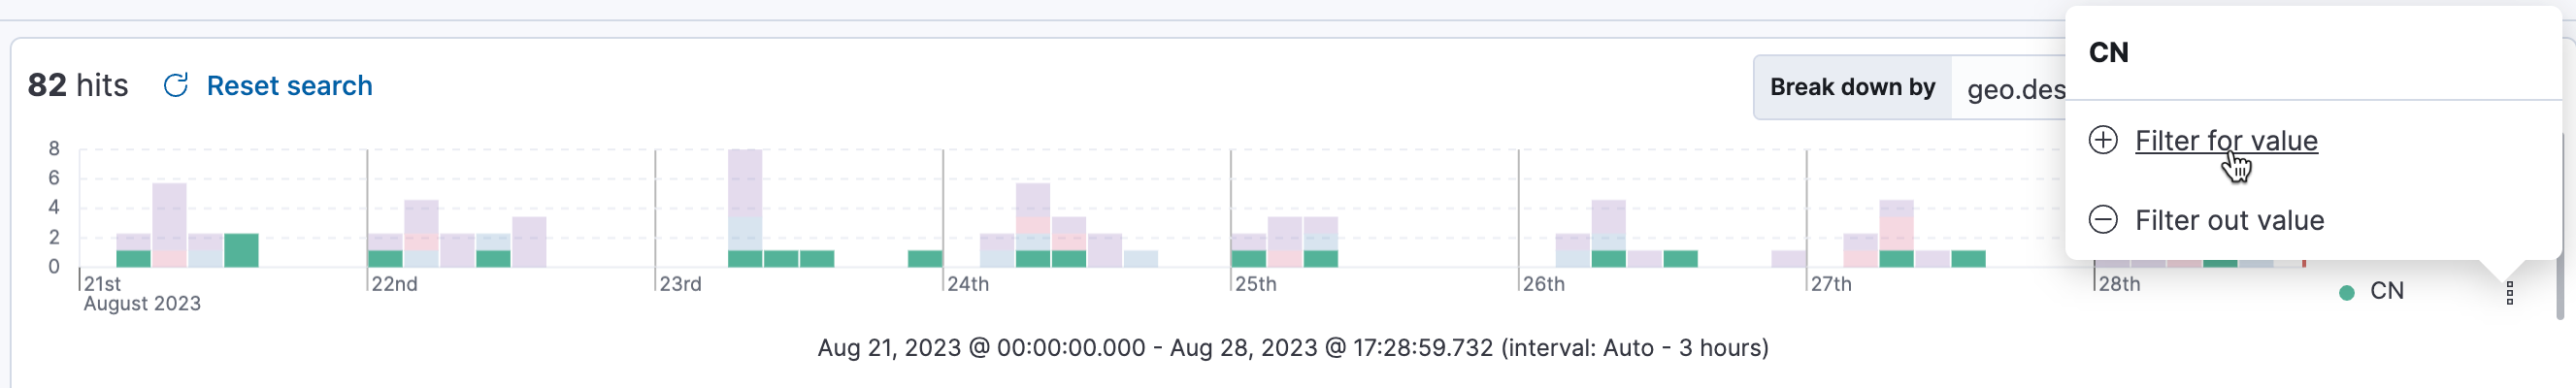 Notice that a filter for
 geo.destis automatically created.
-
Finally, let's add a filter for the response of 404, but this time using the Document Table. Make sure that Response is a column in the table. Hover the pointer over 404 in any row of the table. The + and - icons will appear. Click the + icon to add a filter for
responseof 404. Remove all the text from the Query Bar and click Update.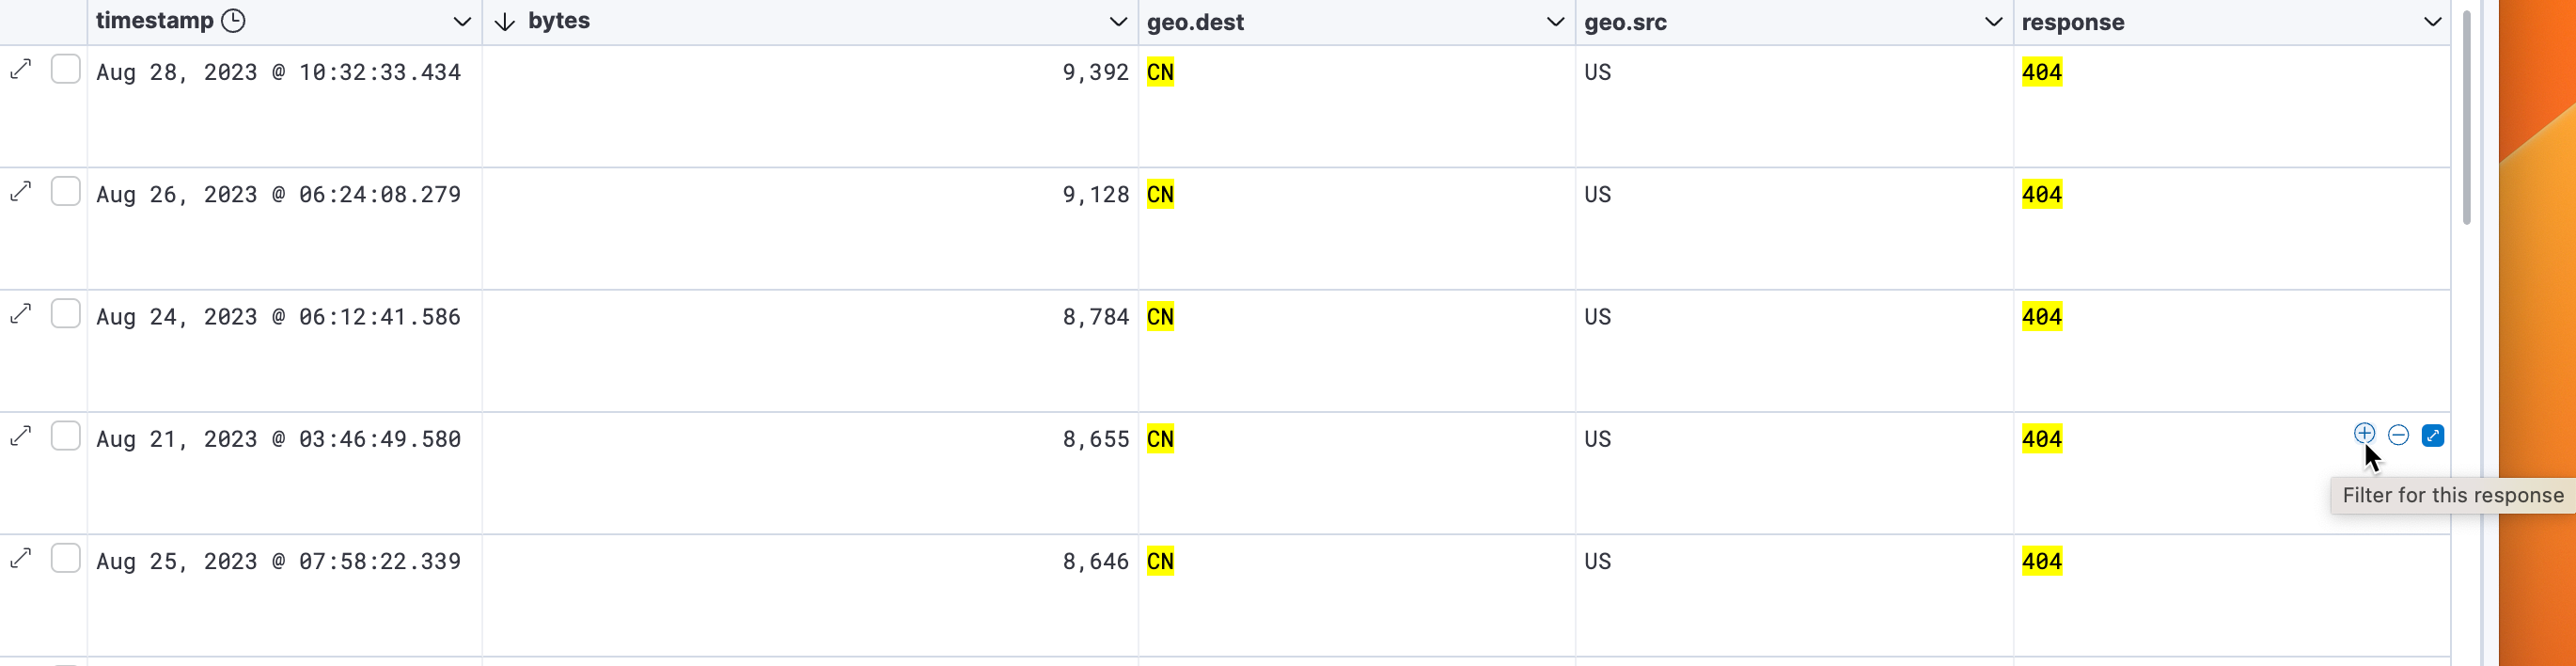
-
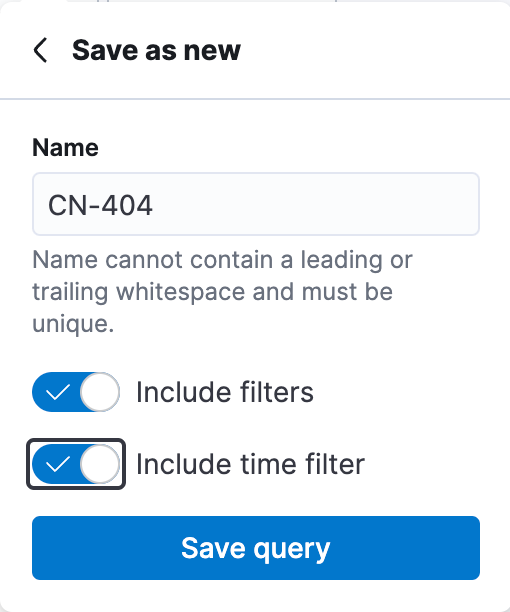
This is a good set of filters, so let's save it as a saved query. Click the button close to the + icon at the left end of the Query Bar, and select Save query. Name the query CN-404 Query and include the filters and time filter.
-
Now let's work with the filters. Click on the
bytes more than 3000filter and select Exclude results. Notice that the table now shows results with less than 3,000 bytes. -
Temporarily disable the
geo.dest:CNfilter. Click on the filter element and select Temporarily disable. The results are updated on the Document table accordingly to that. Delete thegeo.dest:CNfilter by selecting the X next to the filter name. -
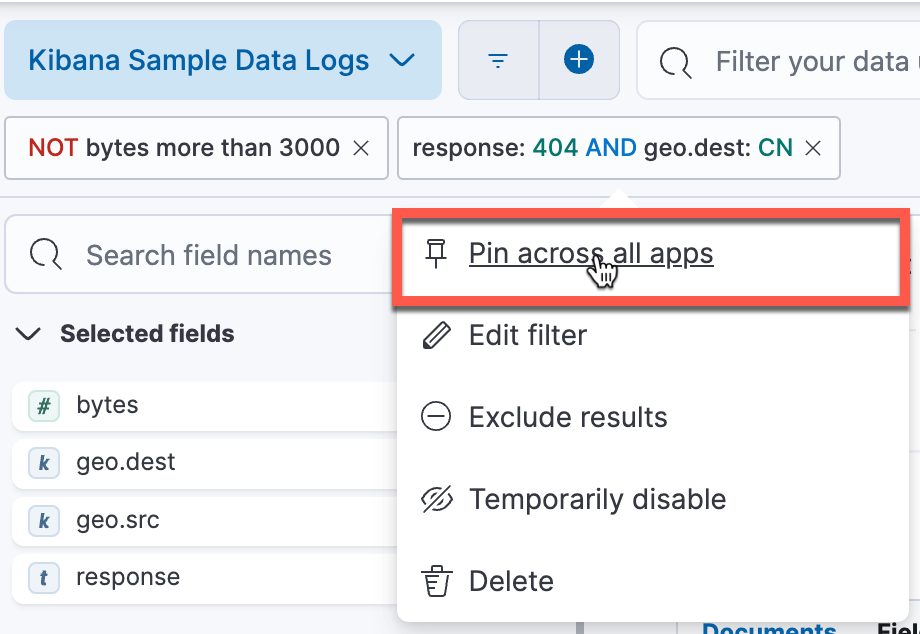
Edit the
responsefilter by clicking on the filter element and selecting Edit filter. We do not need to create each filter individually. We can use this menu to create complex filters using OR and AND. Click on AND and add a filter forgeo.dest:CN. When finished click Update filter.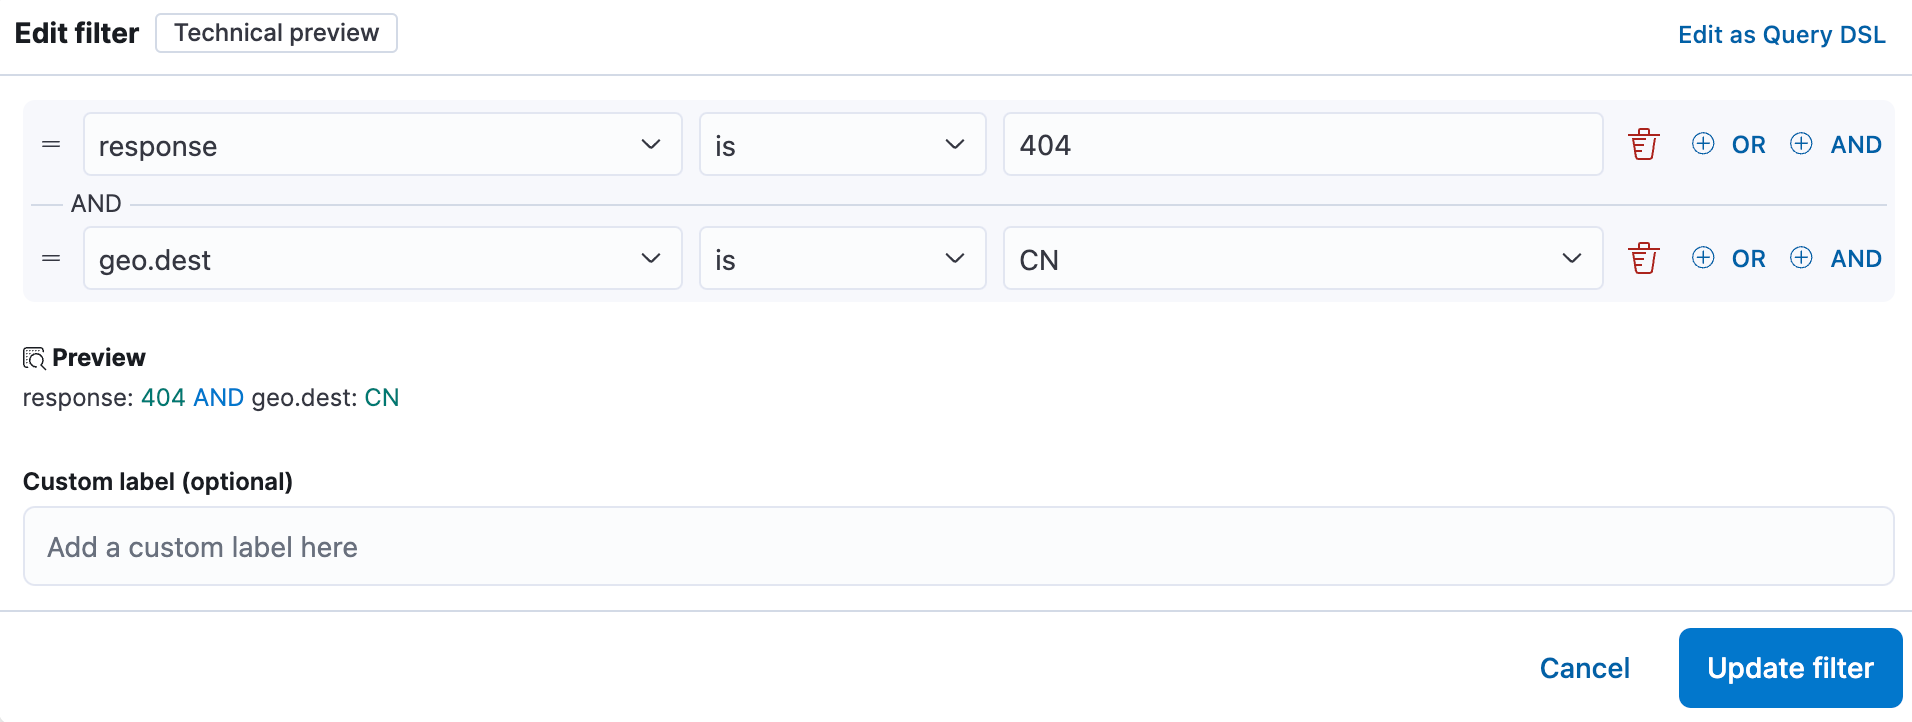
-
Finally, pin this filter. Click on the filter element and select Pin across all apps. Your filters should now look like:
-
Open the Dashboard interface by clicking on:
- > Analytics > Dashboard'
Select the Logs Overview dashboard that you created in the first module. You should see that the pinned filter has followed you from Discover to your Dashboard, but the other filter did not.

-
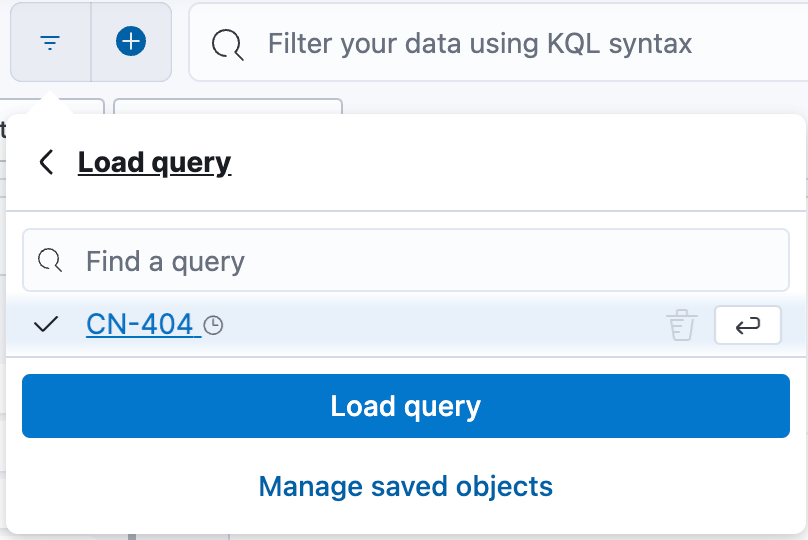
If you'd like to have all your filters back, you can return to Discover and load the previous saved query.
Summary:
In this lab, you created filters and built queries in KQL to explore the web logs data set. You also saved your filters as a Saved Query for later use.