2.1: Discover and Data Visualizer
Objective:
In this lab, you will work with Discover and Data Visualizer to explore the web logs sample data set in more detail. You will also import a CSV log file into Kibana.
-
Use the Data Visualizer to analyze the web logs sample data for the last 7 days. In Kibana open the Machine Learning section by clicking on:
- > Analytics > Machine Learning
-
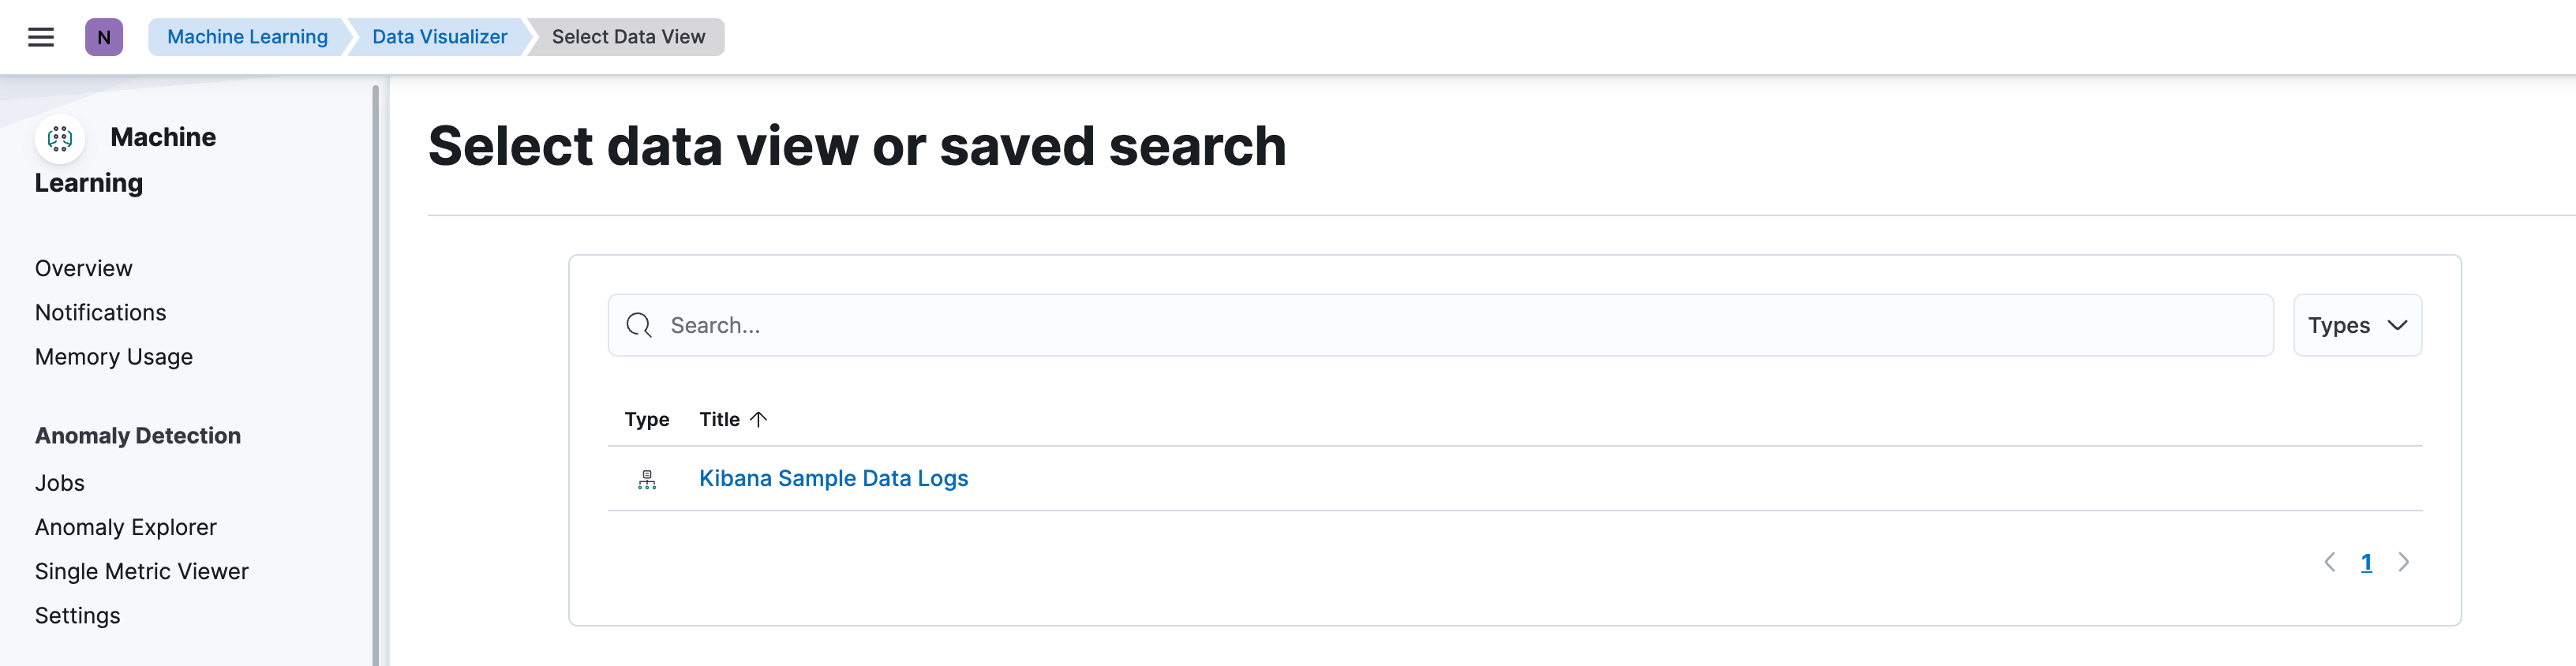
In the Machine Learning section, select Data view under the Data Visualizer section.
-
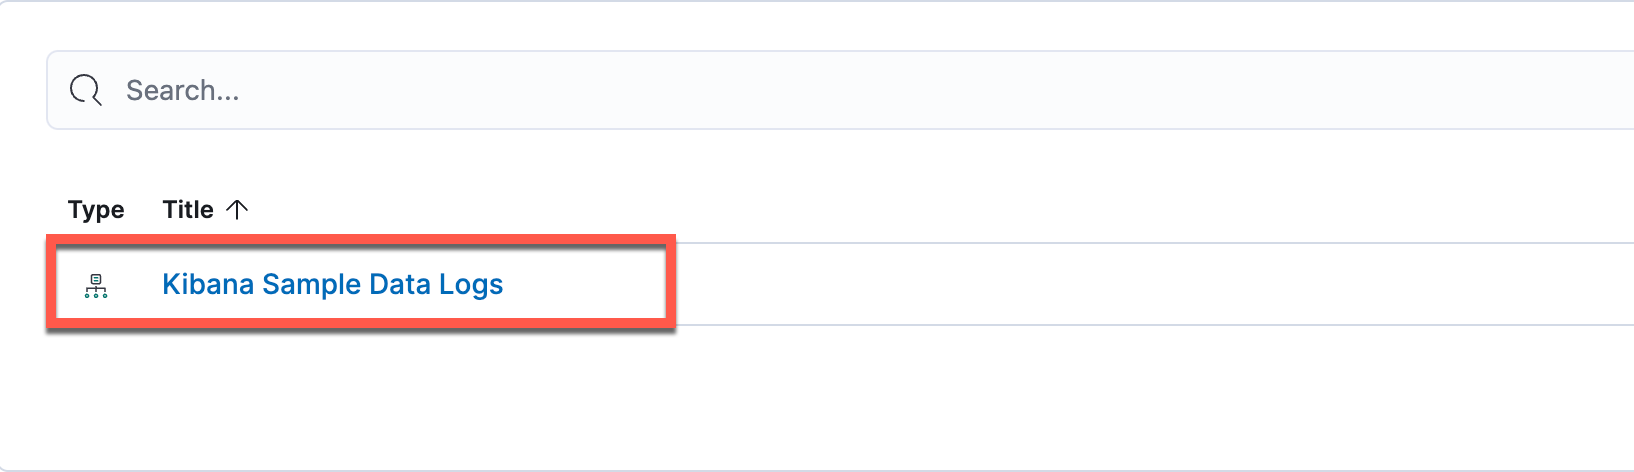
Select the Kibana Sample Data Logs data view.
-
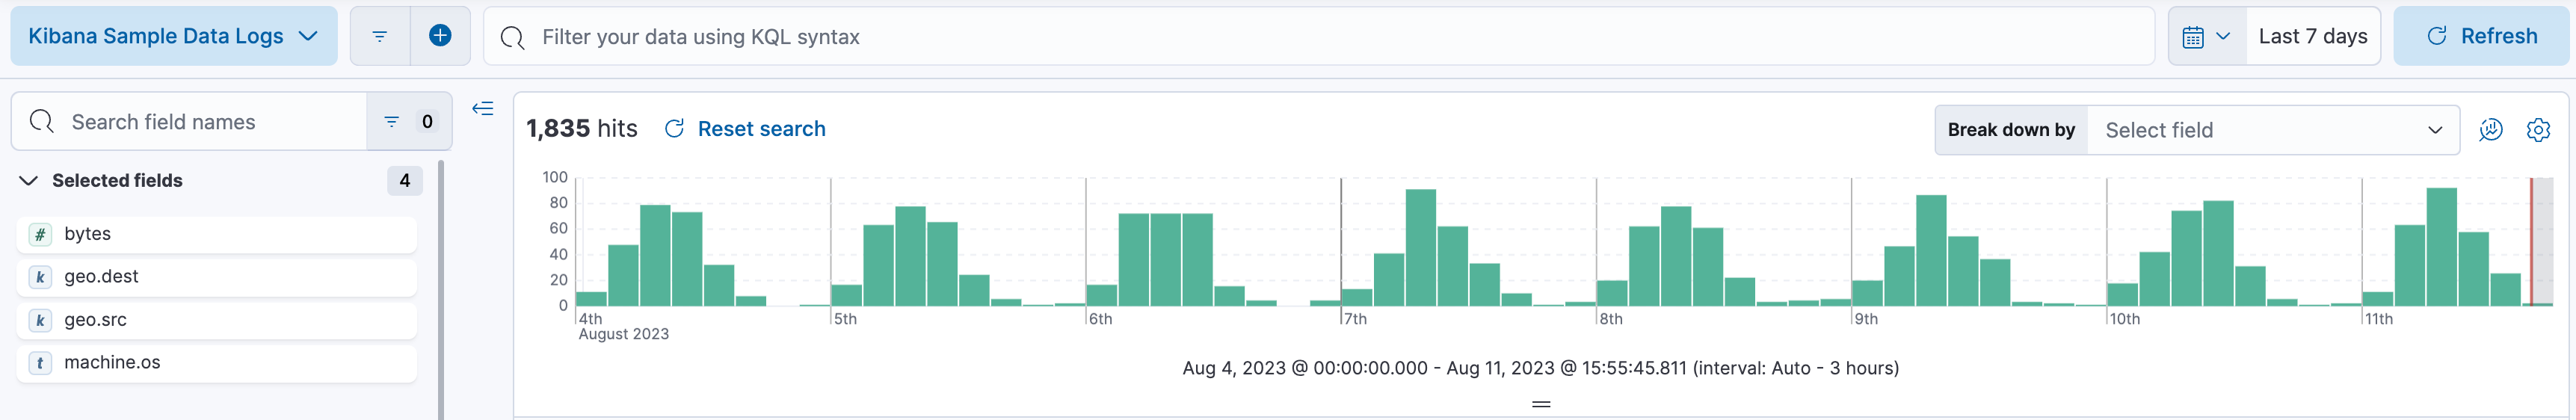
Click on Use full data and in the Time Filter, select Last 7 days. Your view should look like (the number of hits and the histogram may be different):

-
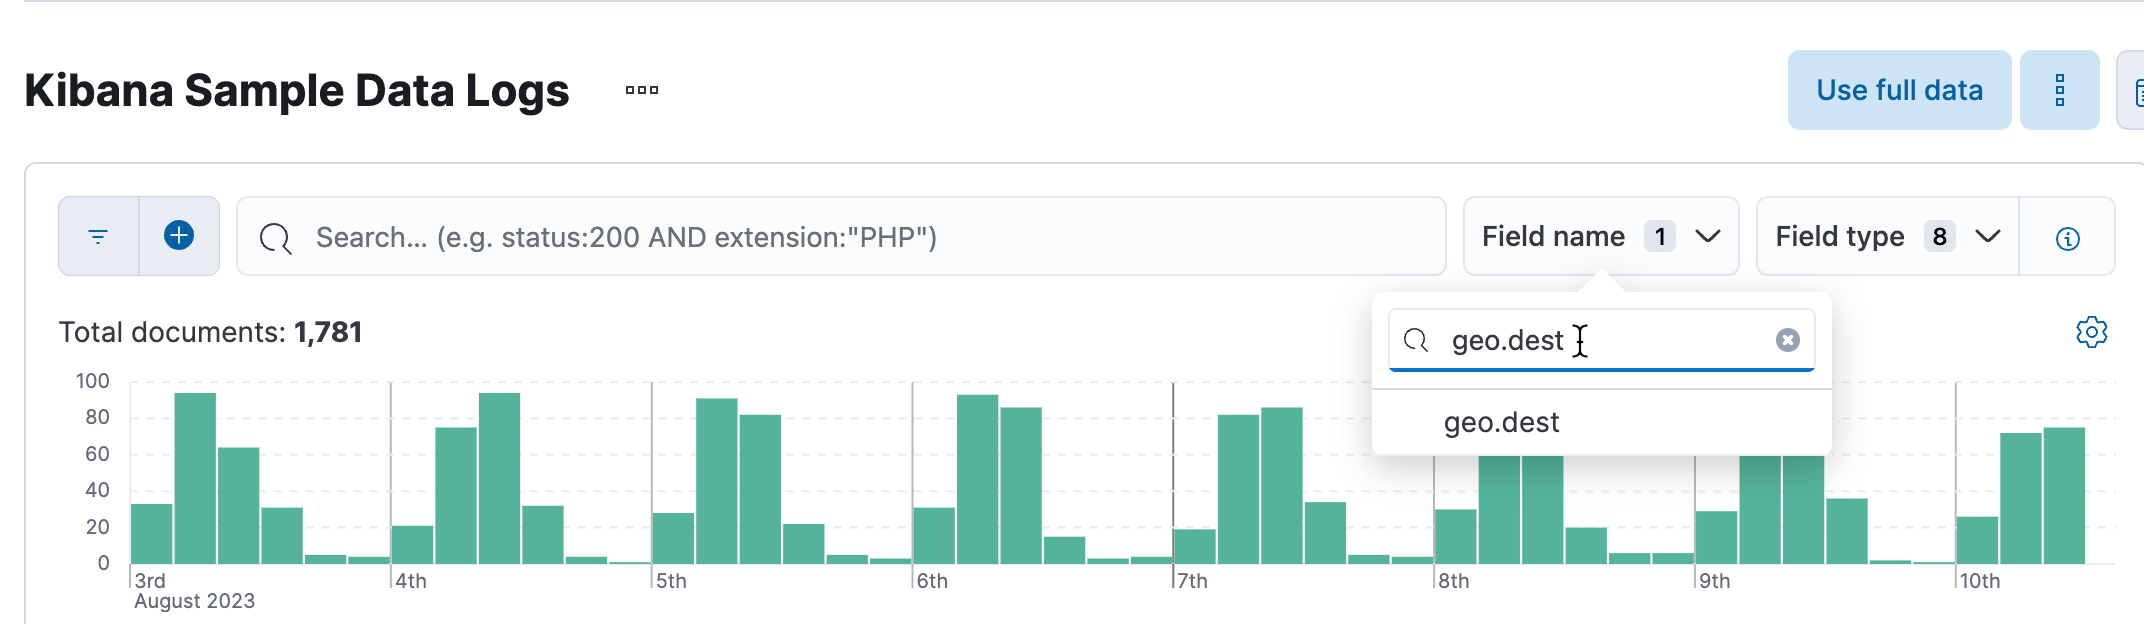
Let's see now what are the most common destination countries. In the Fields List, find the field named geo.dest. The simplest way is to click the Field name drop down and search for the field.
-
Hover over the Distribtions graph to find the most common destination. It's likely to be China (CN) or India (IN). Expand the geo.dest field to see more details, as well as a map of the top destination countries.

-
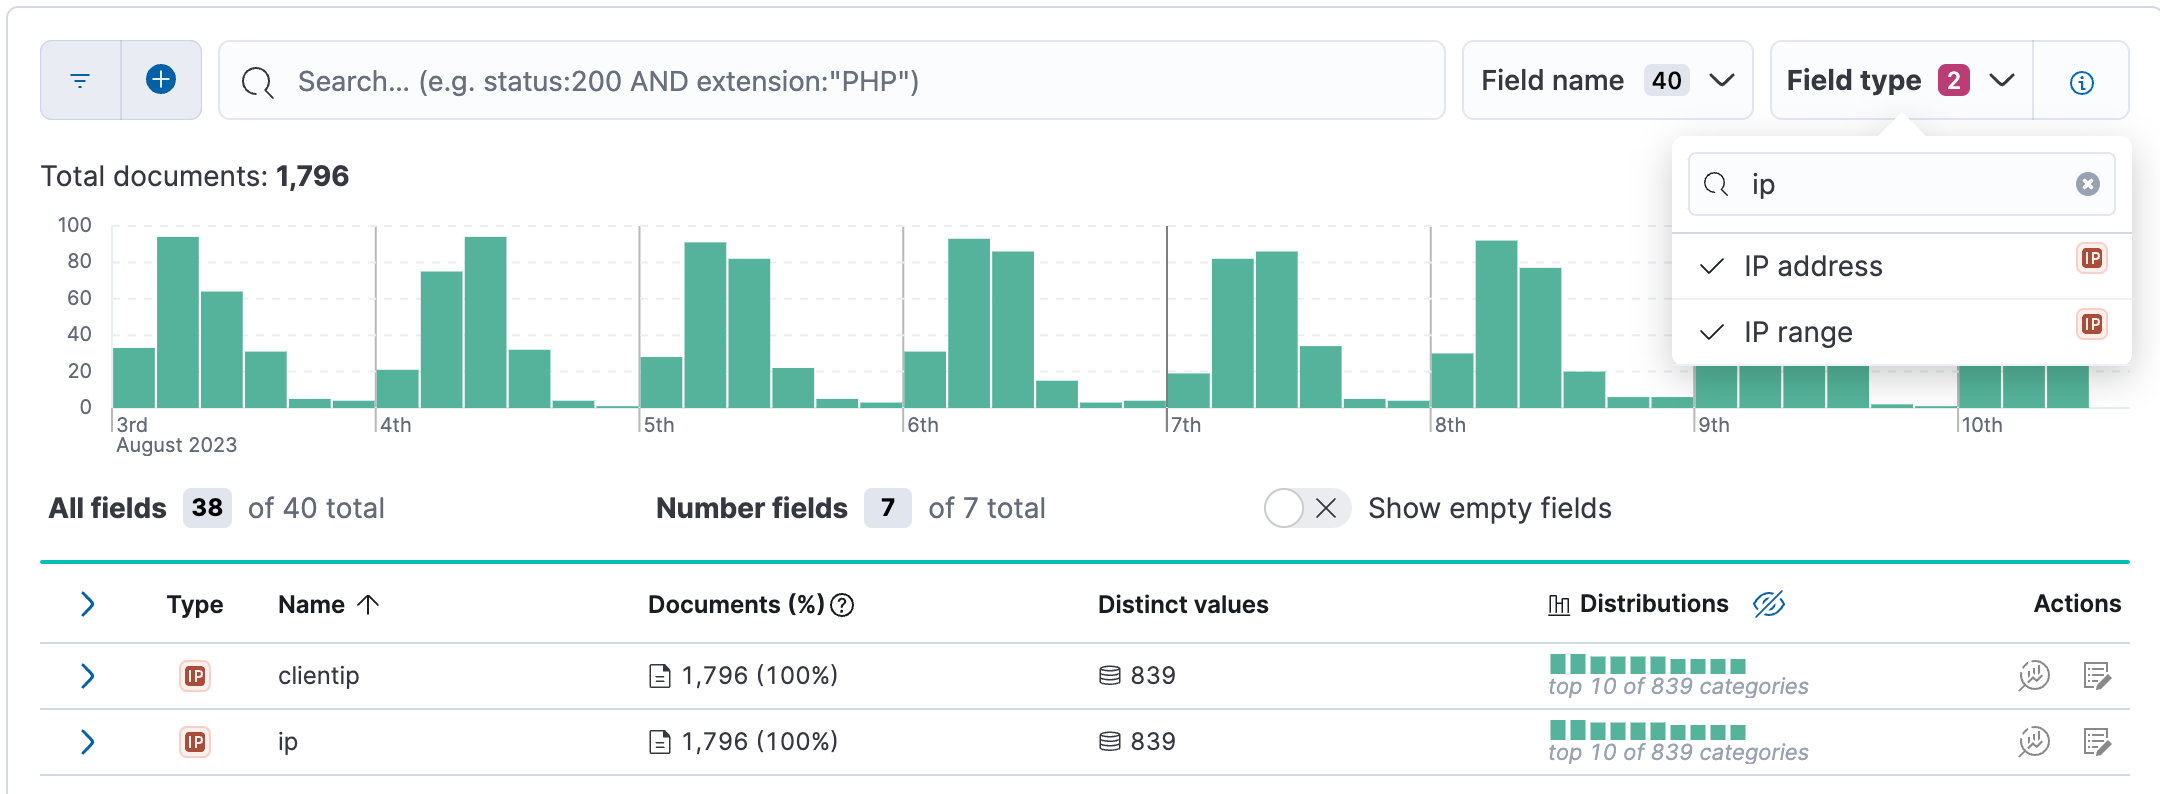
What fields have a field type of "ip"?
- De-select geo.dest in the Field name dropdown, and then type ip in the Field type input and select both types displayed in the dropdown. You should have two fields with the type of "ip" available: clientip and ip.
-
Next, let's go through the steps to import CSV log file so that we can view the data in Discover. Let's first get a file that we can import.
-
Place this file anywhere on your local machine. You can optionally open the file to view the contents.
-
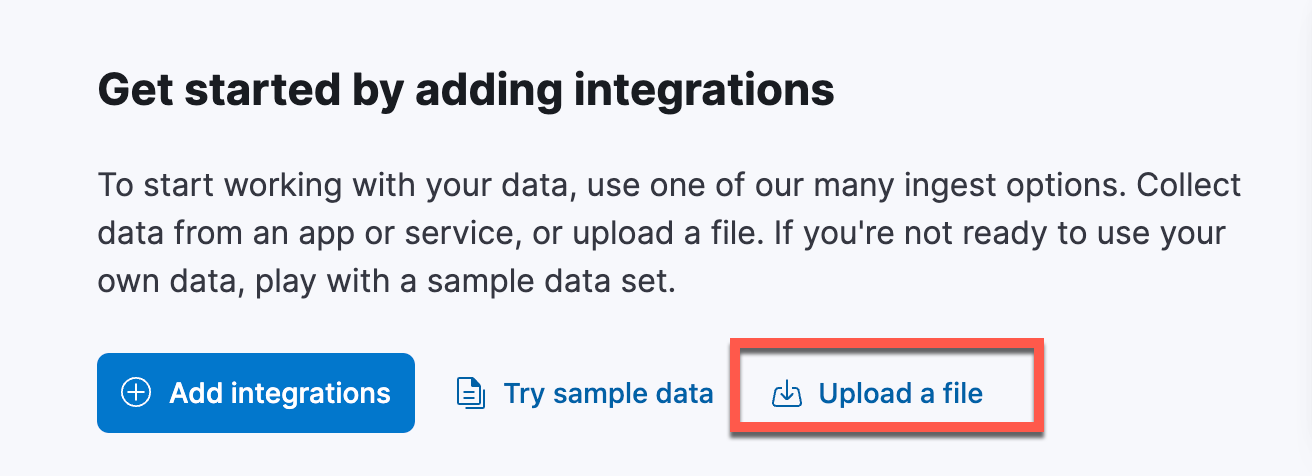
Next, let's upload the file into Kibana. You can upload a file from the Home page by clicking
- > Home and then click Upload a file.
Alternatively, you can upload a file by clicking on:
- > Analytics > Machine Learning and selecting File.
-
Click Select or drag and drop a file to specify the
elasticlogs.csvfile. Once you have selected the file, click Open and it will automatically begin to analyze. You can also drag the file into the area. -
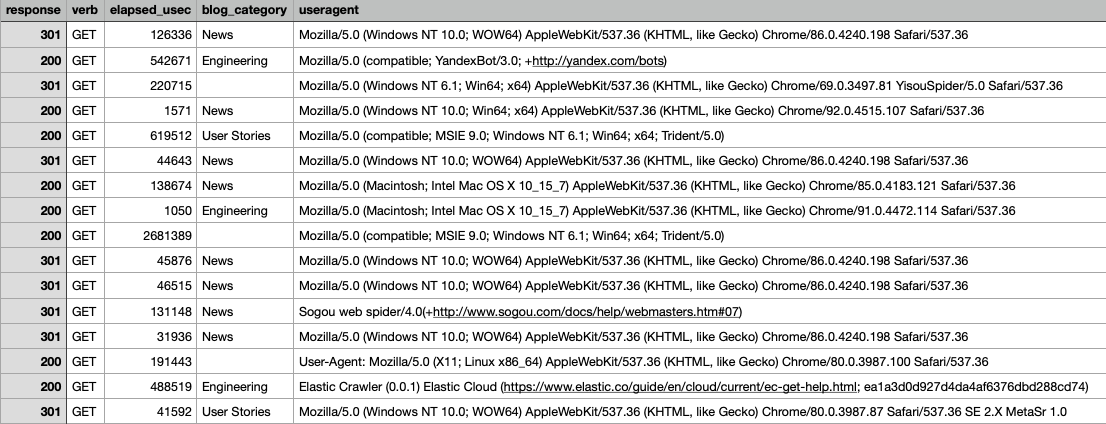
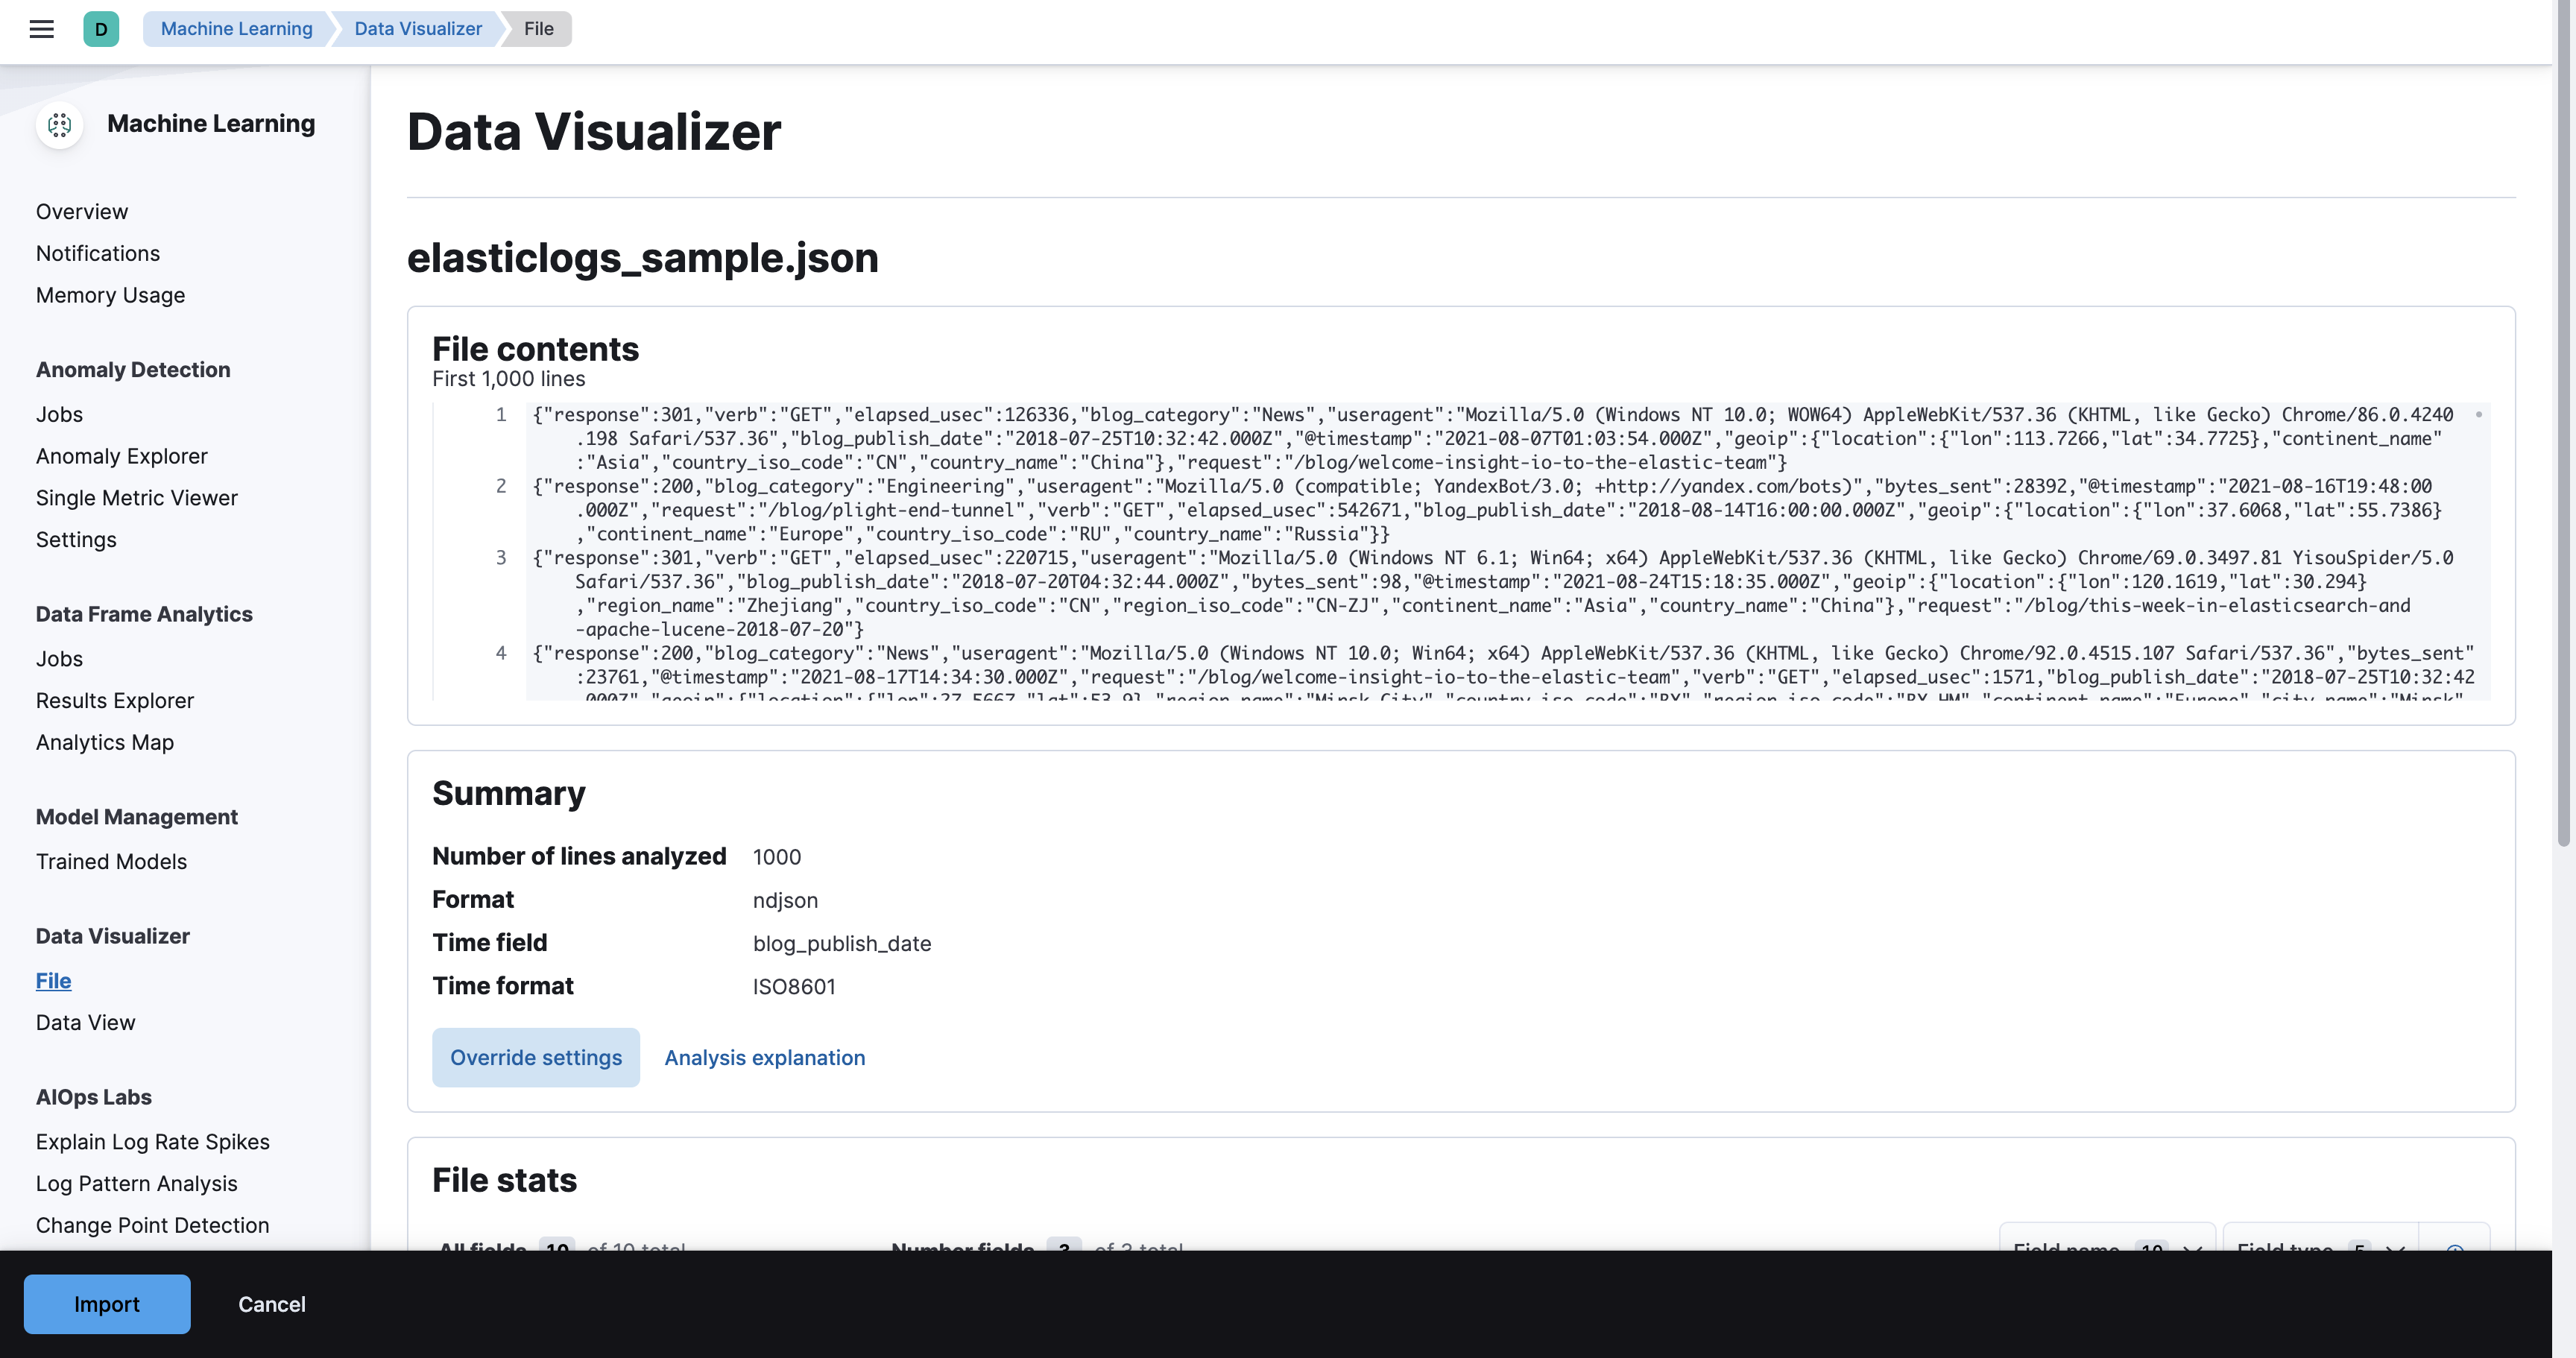
Kibana will return the file contents of the first 1,000 lines as well as other summary information and statistics.
-
Click Override settings to view the date, time, and other settings that can be overridden. When you have finished reviewing the information, click Import to move onto the next screen.
-
On this screen enter the index name
elasticlogs-sample. Make sure Create data view is checked and then click Import.Note: The Advanced tab allows you to update index settings, mappings, and pipeline ingest information. These topcis will not be covered in this course.

And now watch the Kibana upload the data and create the data view.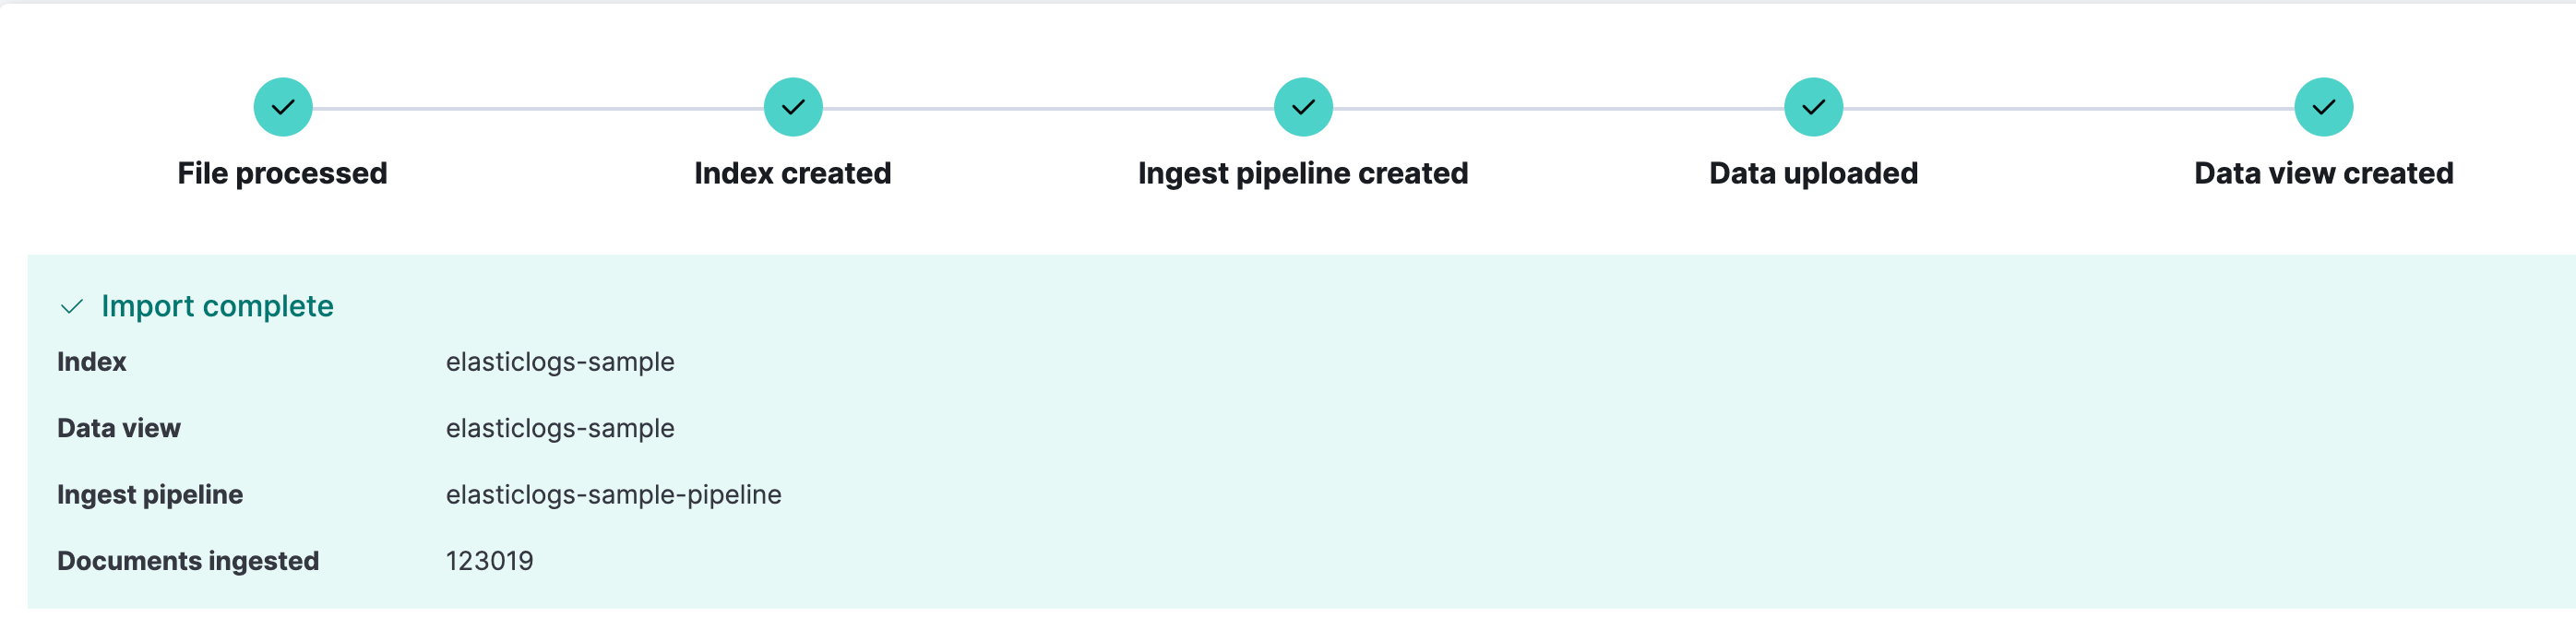
-
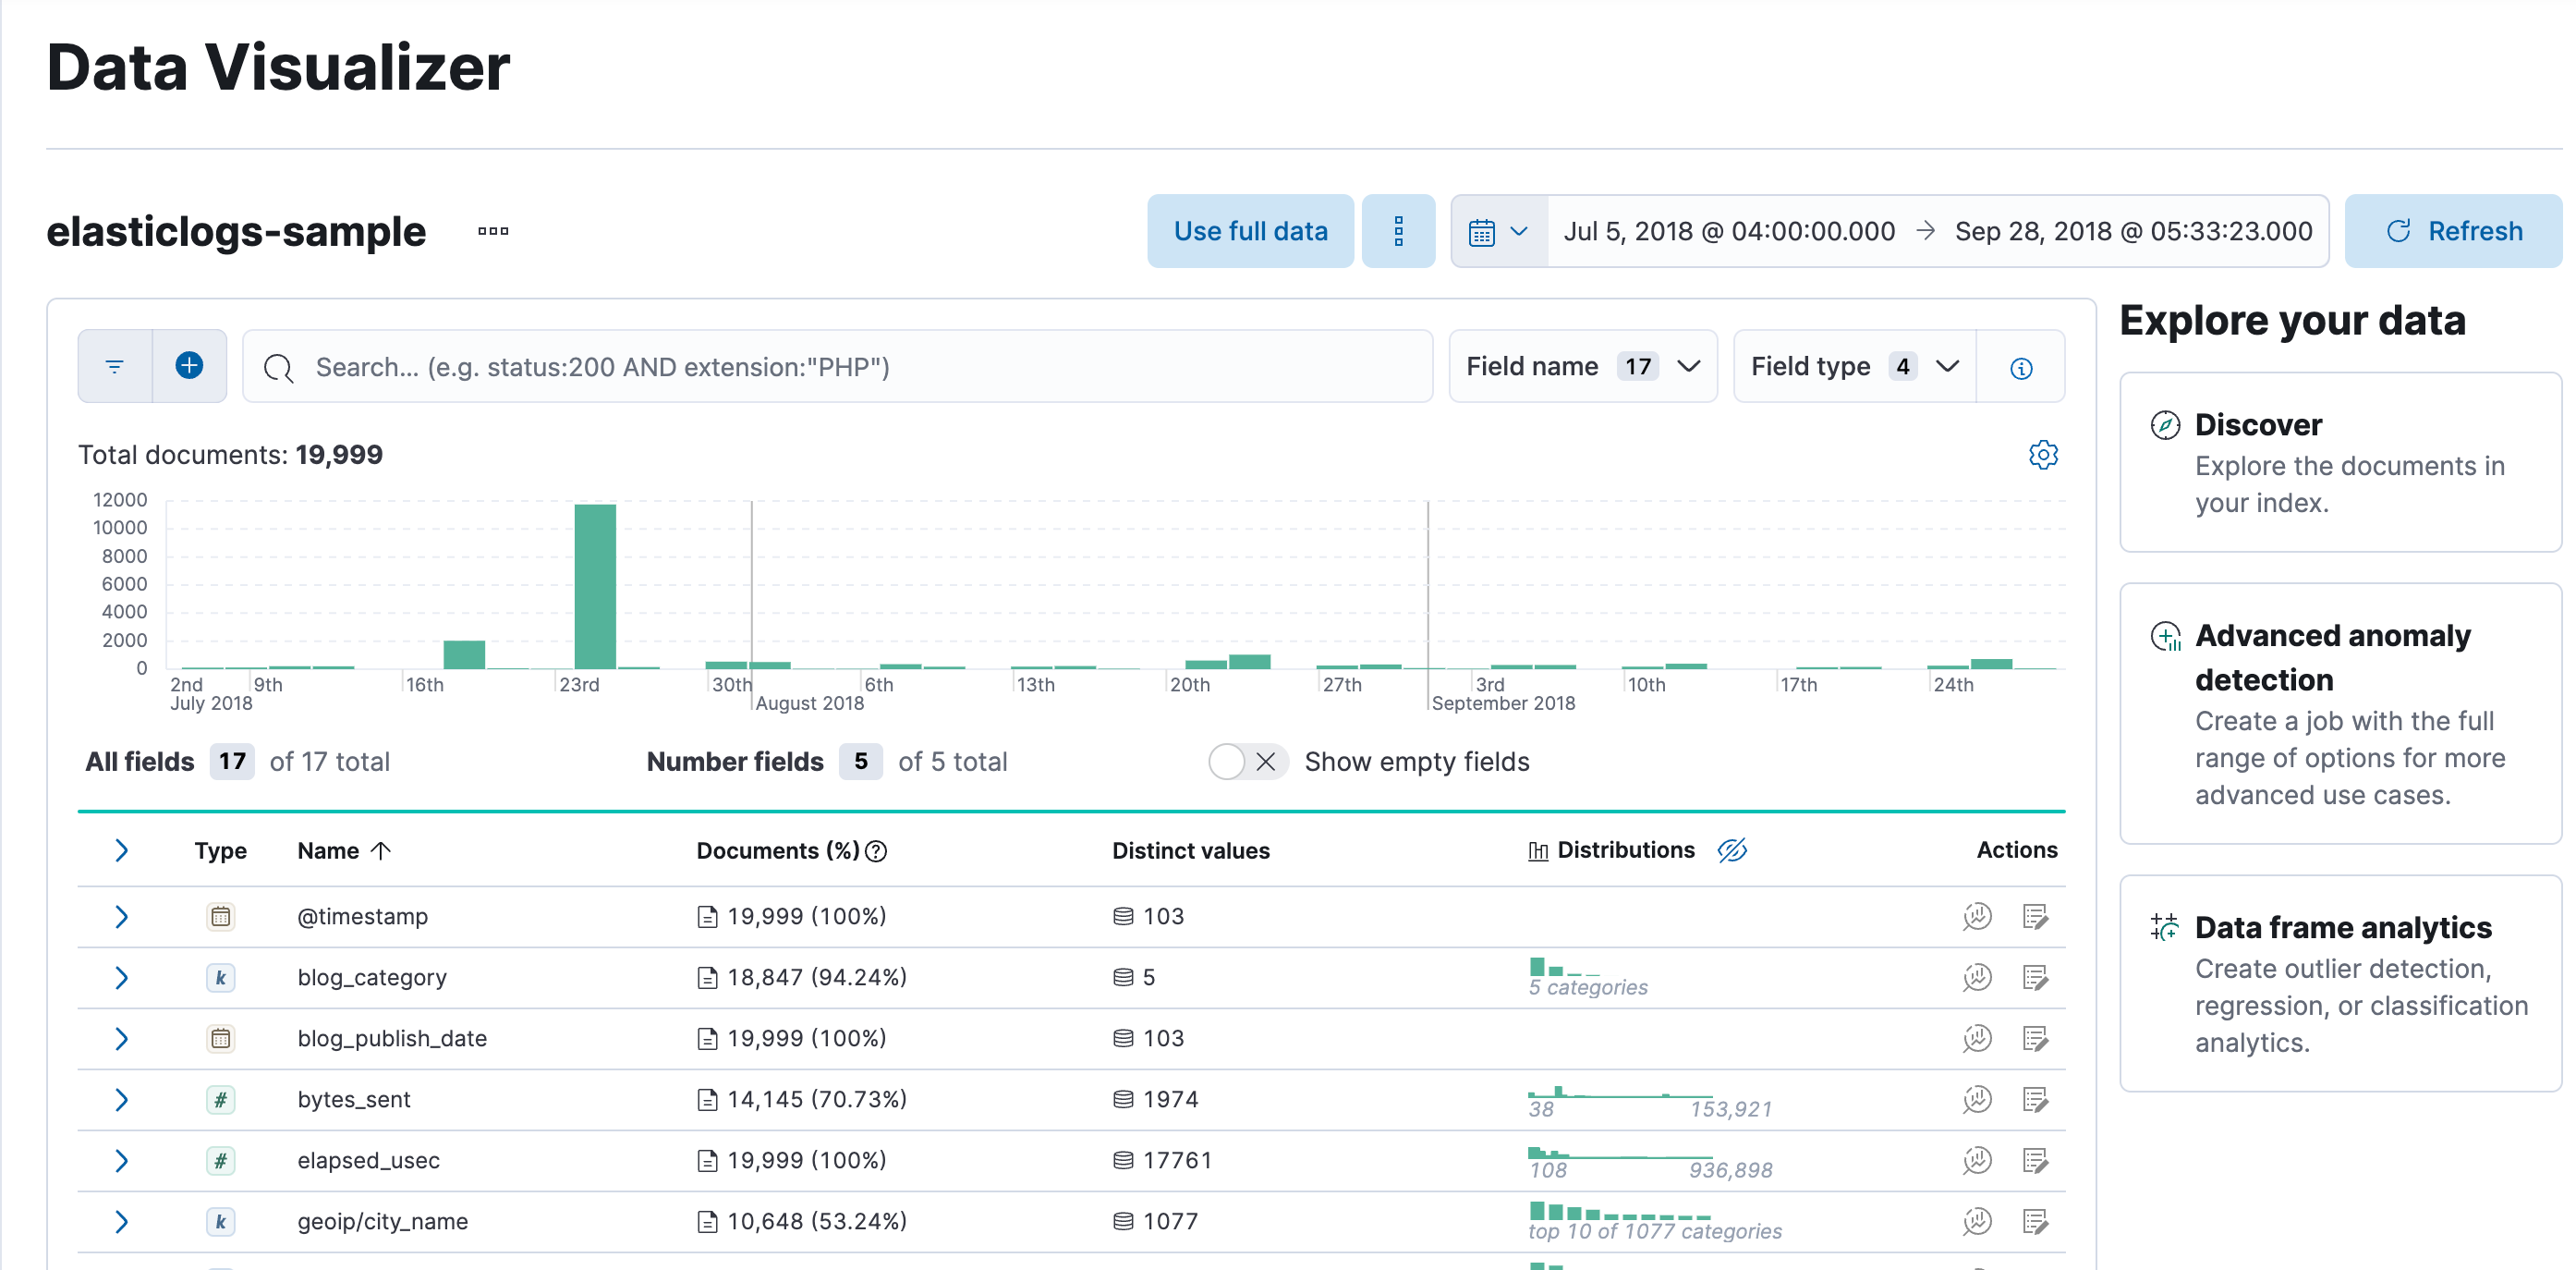
Select Data view under the Machine Learning > Data Visualizer section and you can select the elasticlogs-sample Data View from the list to view the data in the Data Visualizer. Select Use full data to view the import.
-
Now, let's move over to Discover. In Kibana, open the Discover interface by clicking on:
- > Analytics > Discover
-
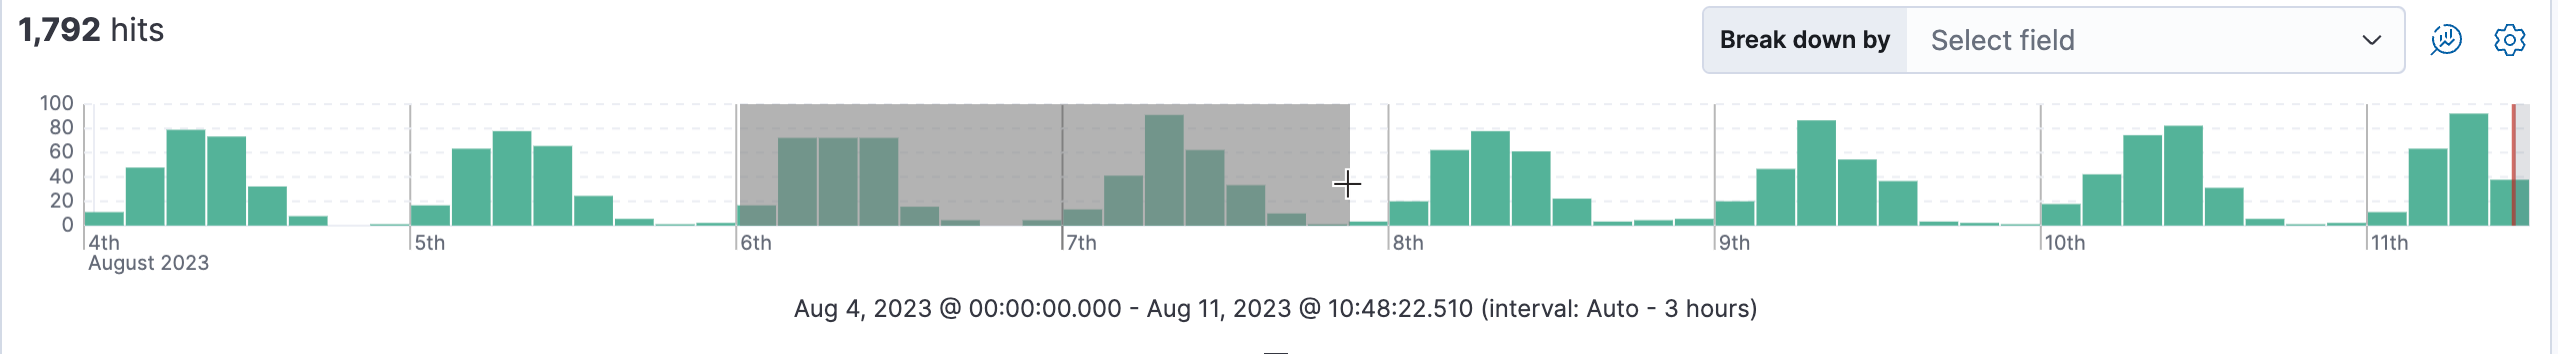
Ensure your time filter is set to Last 7 days and the dataview is Kibana Sample Data Logs.
-
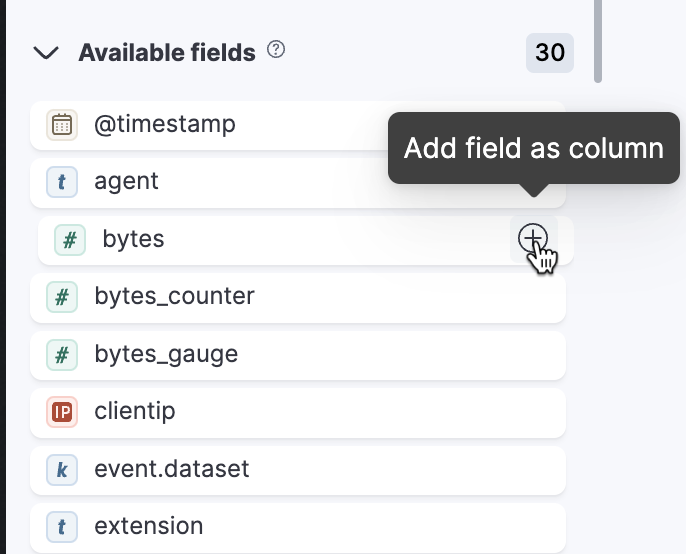
Create a document table with the columns bytes, geo.src, and geo.dest. First of all in the list of Available fields find the bytes field. Click the + icon to add the bytes field to the Document Table.
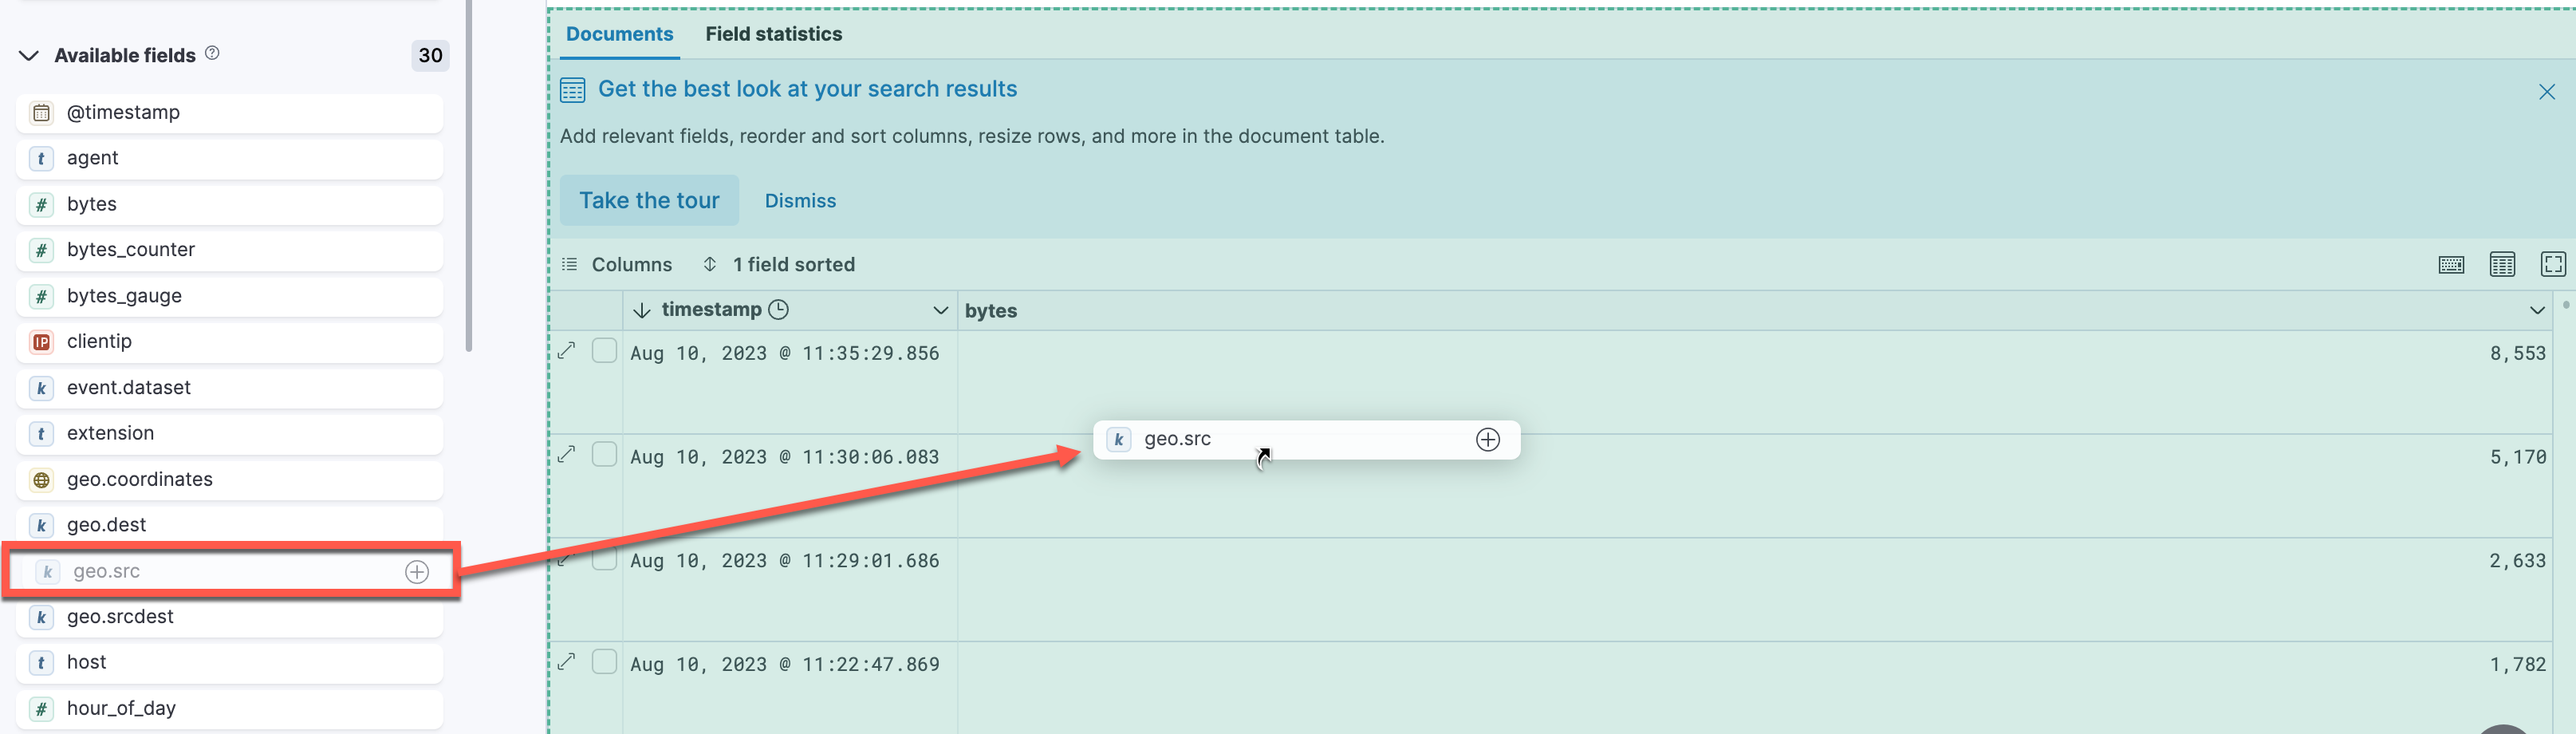
Alternatively, for the geo.src and geo.dest fields, you can drag each field from the Available fields list over to the table to create a column.
-
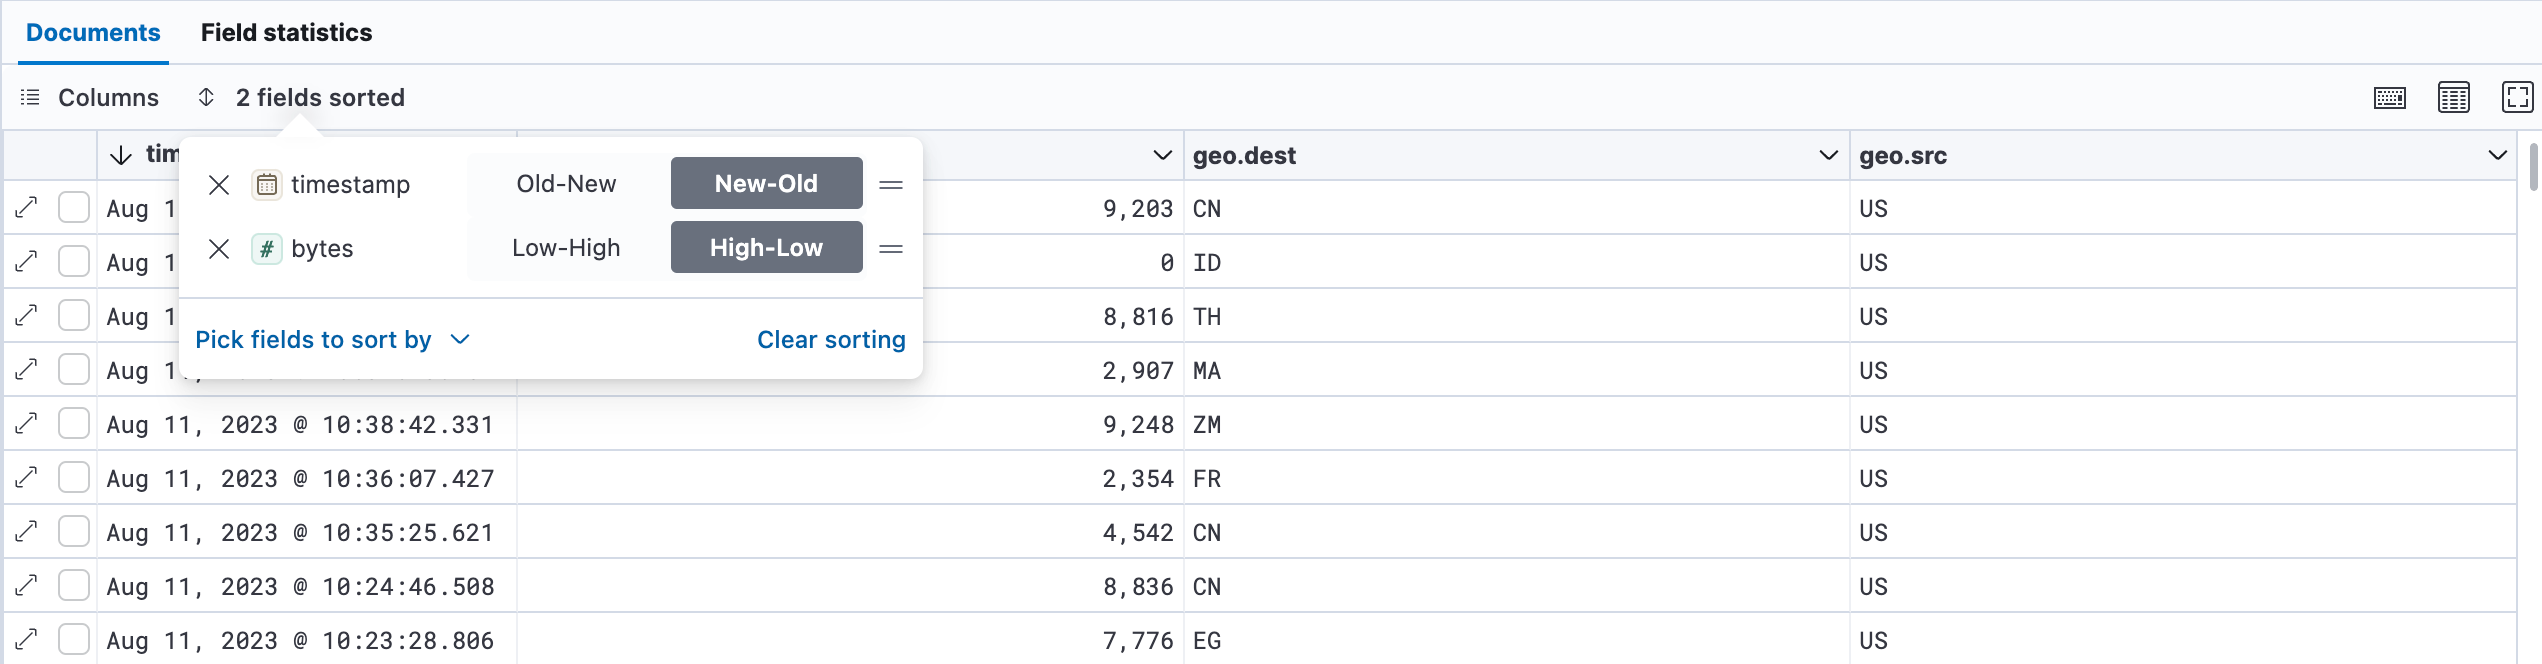
You can sort or move any of these columns. Hover over the column header for the geo.src field. Move the geo.src column to the right of the geo.dest column by clicking on the arrow icon and select Move right. Then click the arrow next to bytes in the column header and select Sort High-Low. Did your view change?
Show answer
Chances are, it did not, because the Document Table is already being sorted first by the timestamp field by default. Click 2 fields sorted in the header of the table to remove the sorting on the timestamp.
-
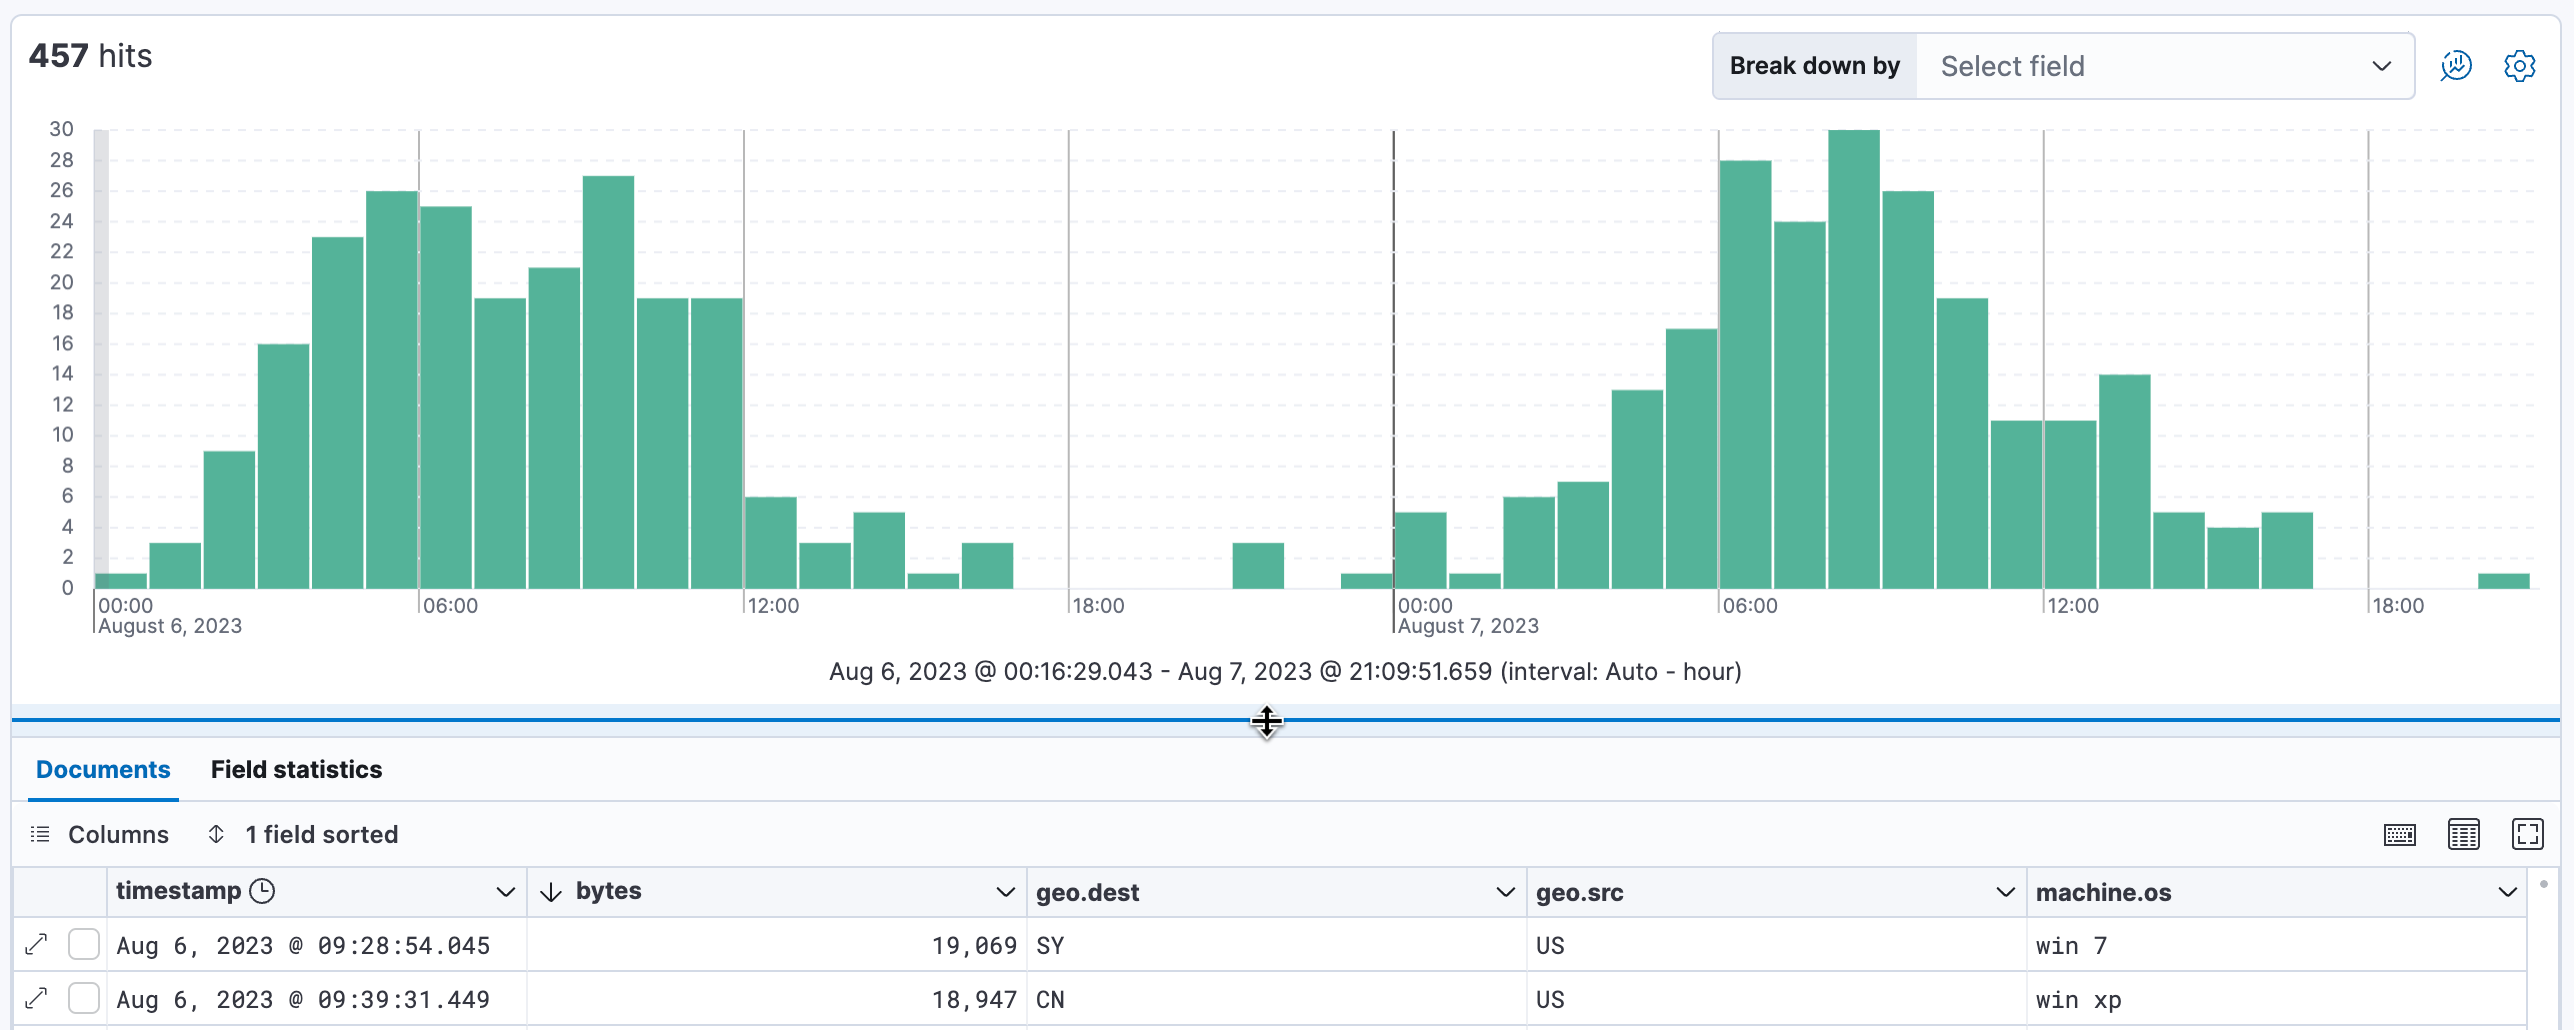
Select the row with the highest number of bytes and expand the document by clicking on the double arrow icon. In the Table view, look for the machine.os field. Hover over the field, and click the fourth icon, which will show a tooltip of Toggle column in table.
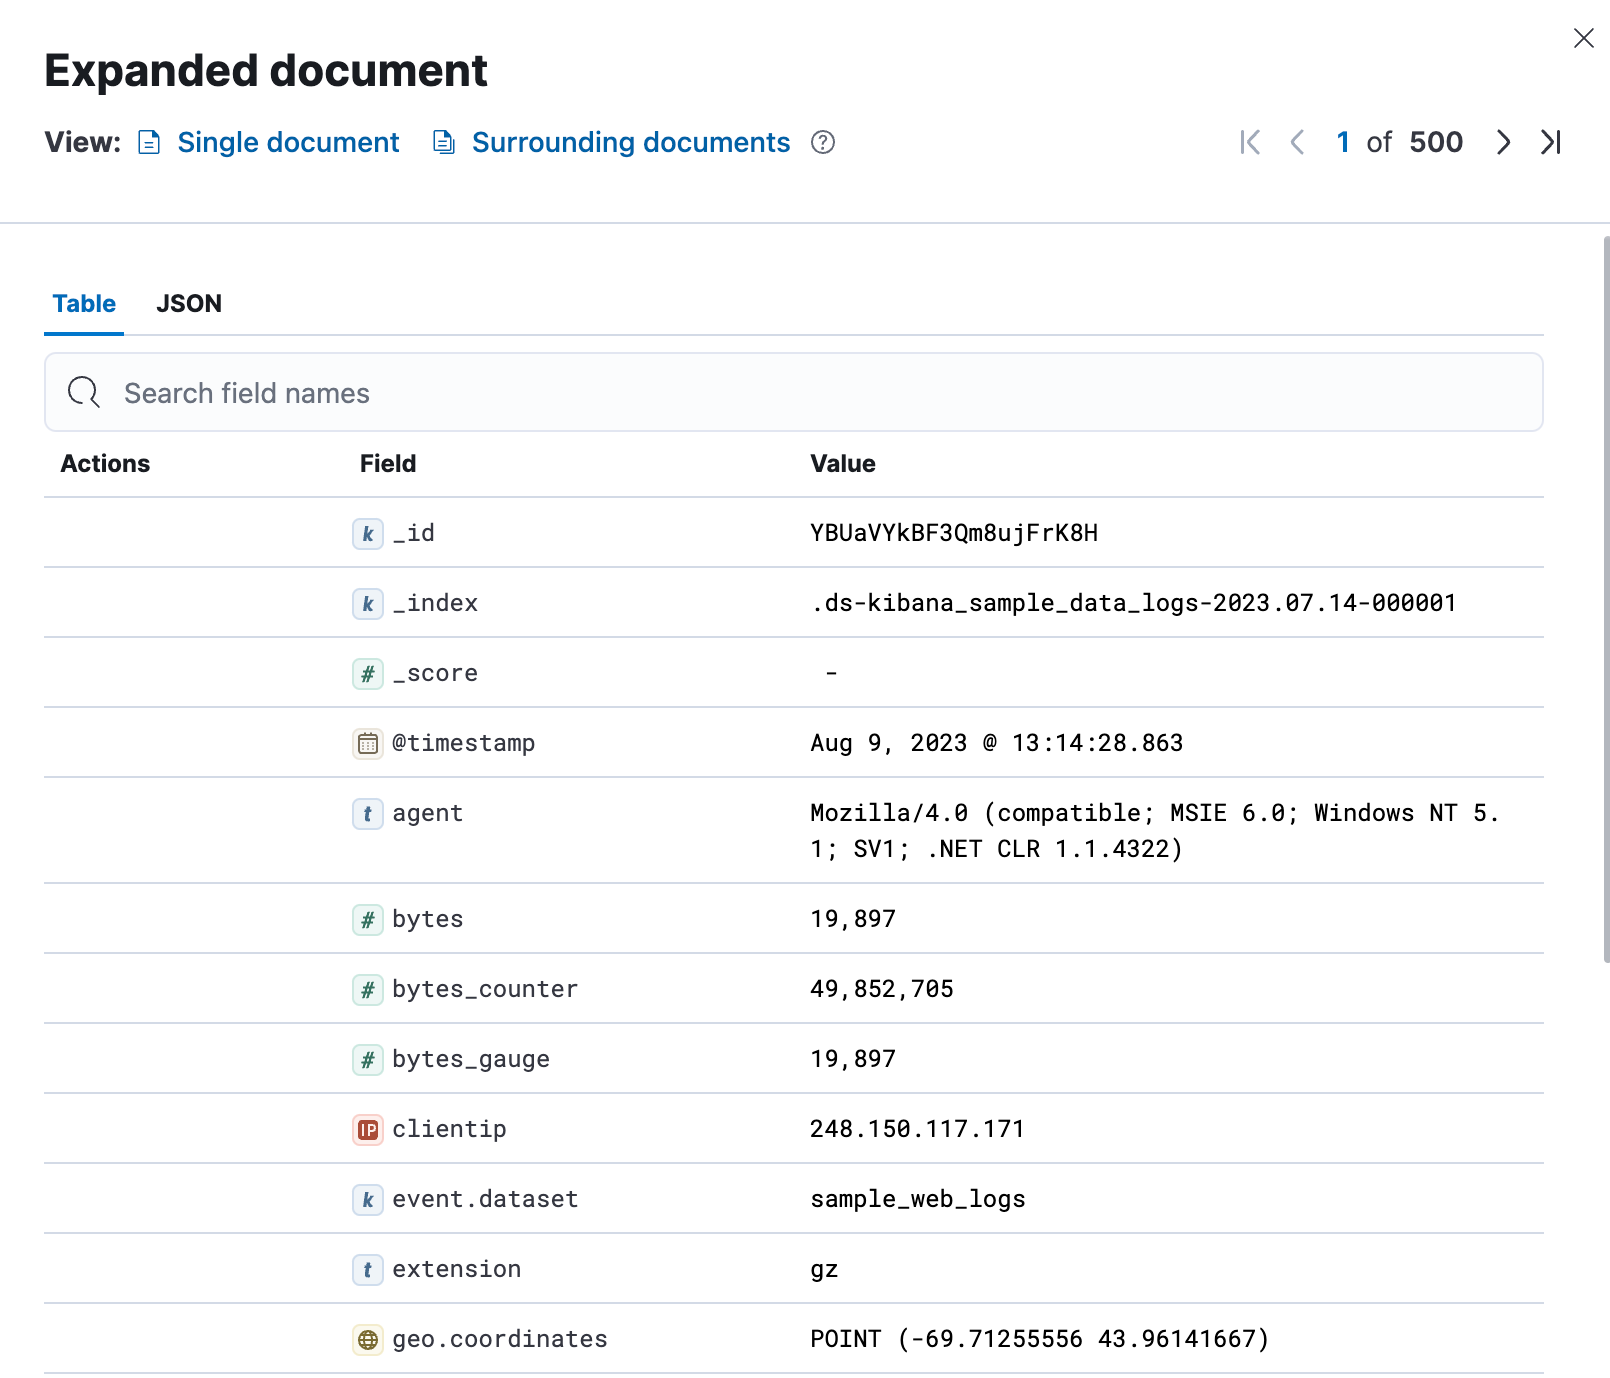
Close the Expanded document view by clicking the x in the panel. The machine.os field is now included in the table. Click down arrow in the machine.os header and select Remove column since we will not be using it.
-
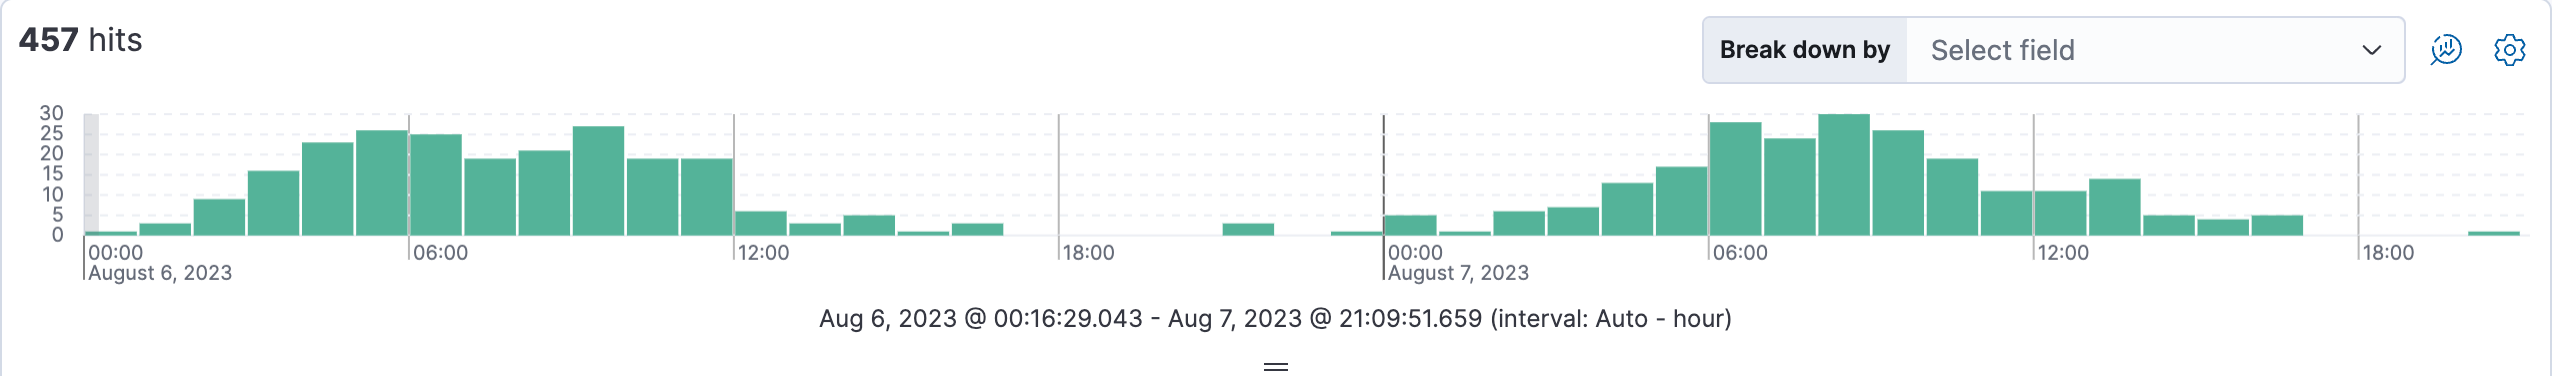
In the Histogram area, sweep across a complete bell curve in the view. This should update your Time Filter to show approximately one day of logs.
-
In addition to toggling the display of the histogram, you can now change its height by grabbing the = icon and dragging it up and down.
-
Go back to the previous view by hitting the back button in your browser, or by selecting Last 7 days from the Time Filter.
Summary:
In this lab, you explored the web logs data set with the Discover and Data Visualizer tools. You also imported a CSV log file into Kibana.