6.4: AIOps Labs
Objective:
In this lab, you will discover how you can use AIOps Labs to quickly understand your data.
-
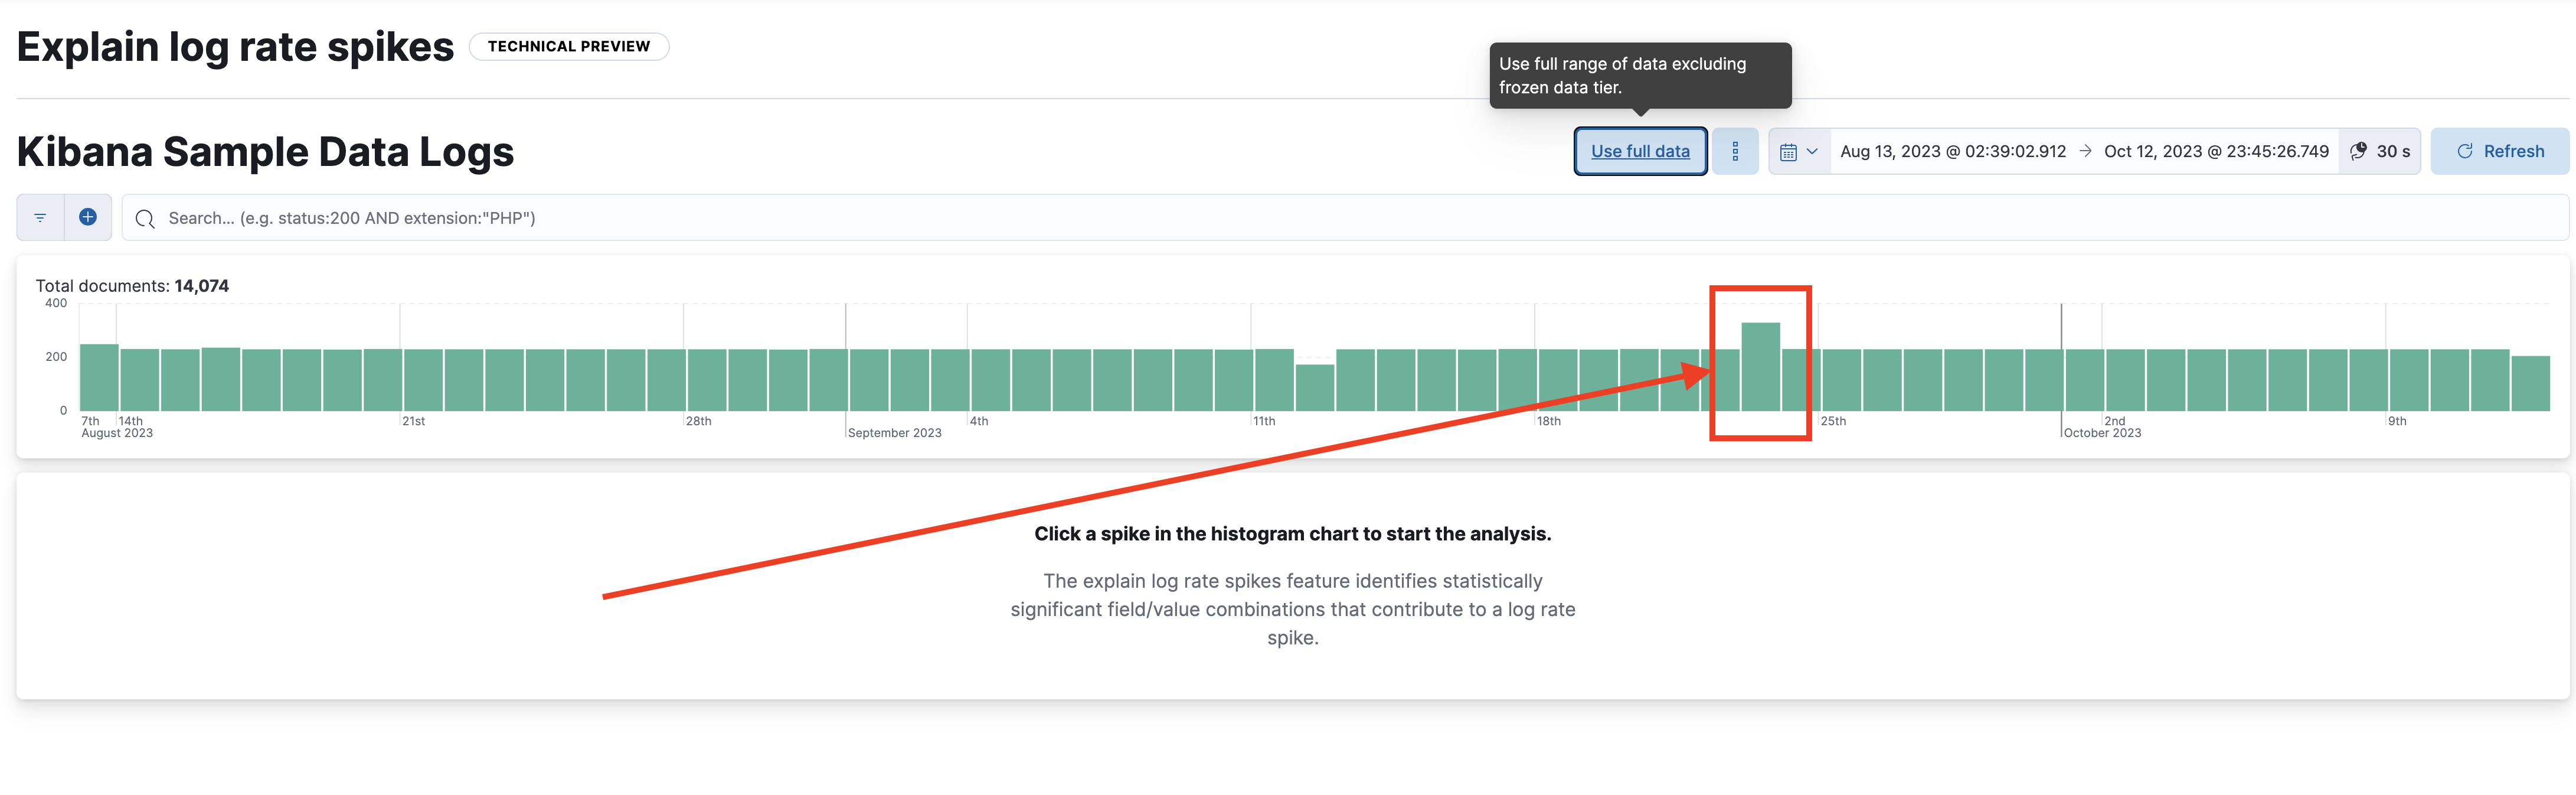
Let's start with the Explain Log Rate Spikes tool. In the machine learning section, click Explain Log Rate Spikes under AIOps Labs.
-
Analyze the log rate of the Kibana Sample Data Logs data view.
Update the time range to use the full data. -
You will notice a spike in the histogram, click on it to start the analysis.
-
The analysis will automatically start and you'll get results in a few seconds. Which field has the highest impact on this spike?
Solution
The
clientipfield -
What
clientipis the origin of this log spike? How many docs are from this IP?Solution
The
clientip30.156.16.164 and it concerns 100 documents. -
Next, let's focus on the Log pattern analysis. Open Discover and select the Kibana Sample Data Logs data view.
On the left-hand side, click on themessagefield to see the top values. This will not provide you with useful information.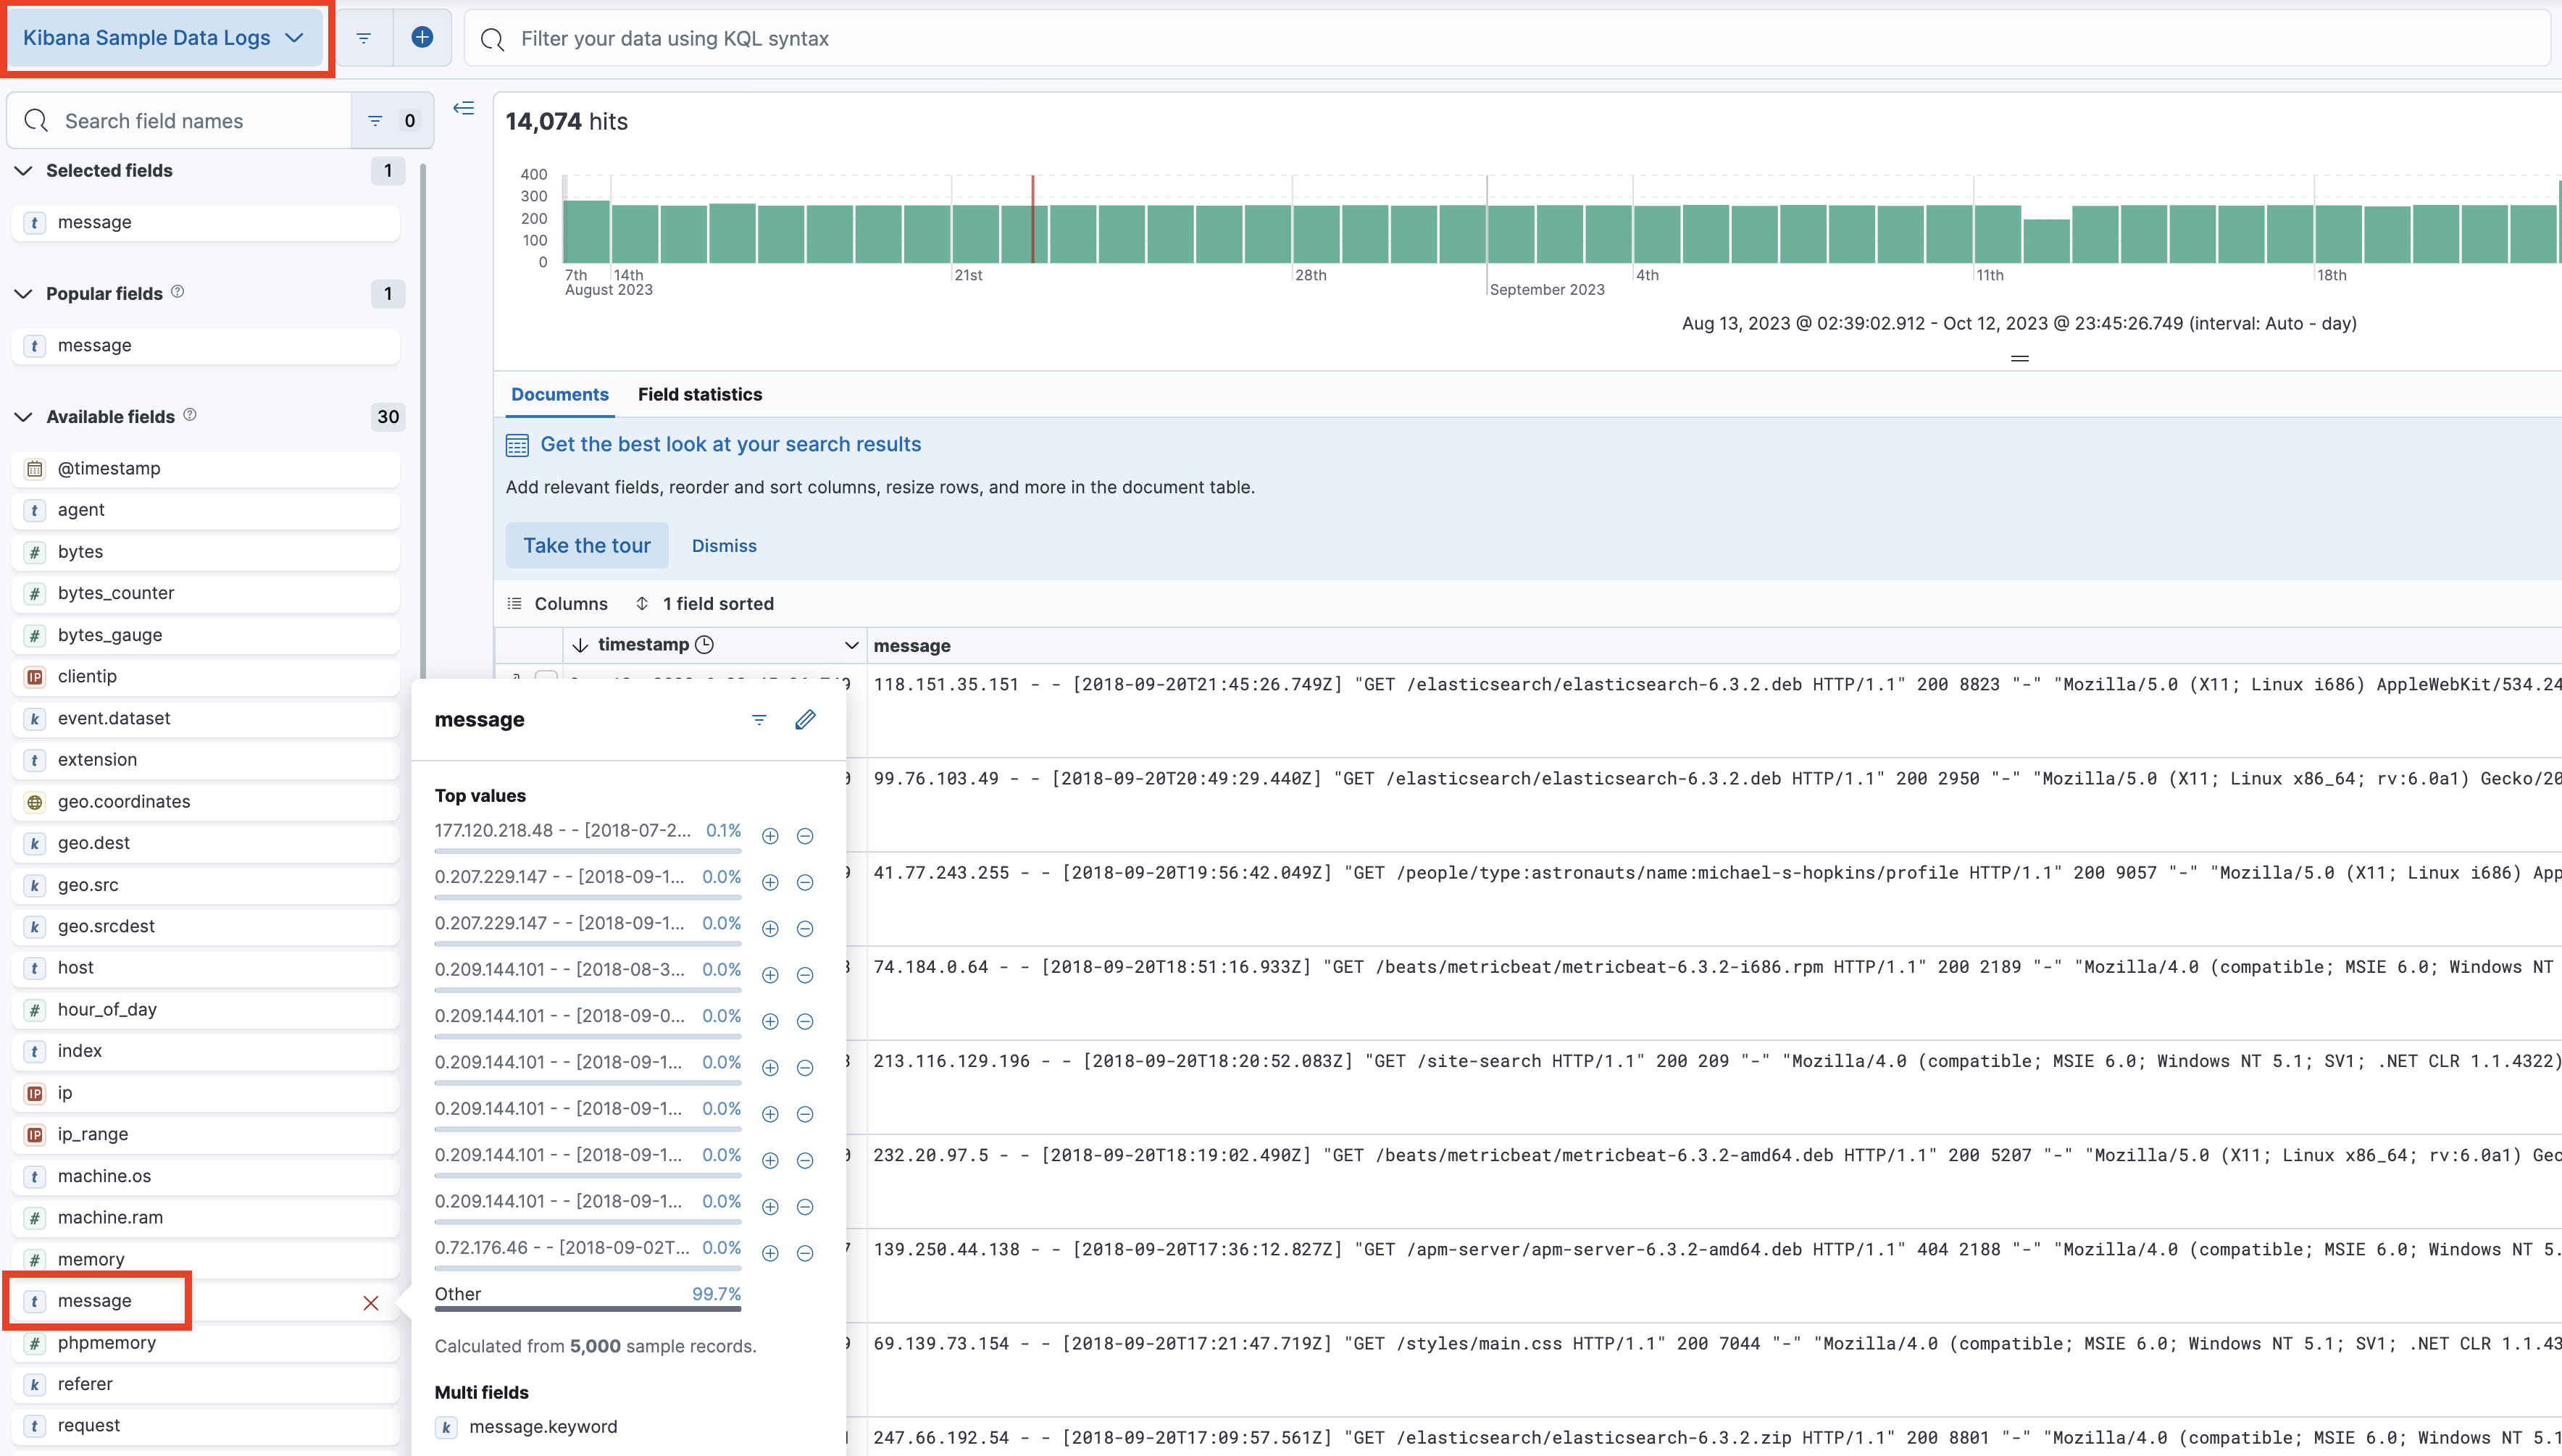
-
Return to the machine learning section and select Log pattern analysis under AIOps Labs. Choose the Kibana Sample Data Logs data view.
-
Under Category field choose
messageand run the pattern analysis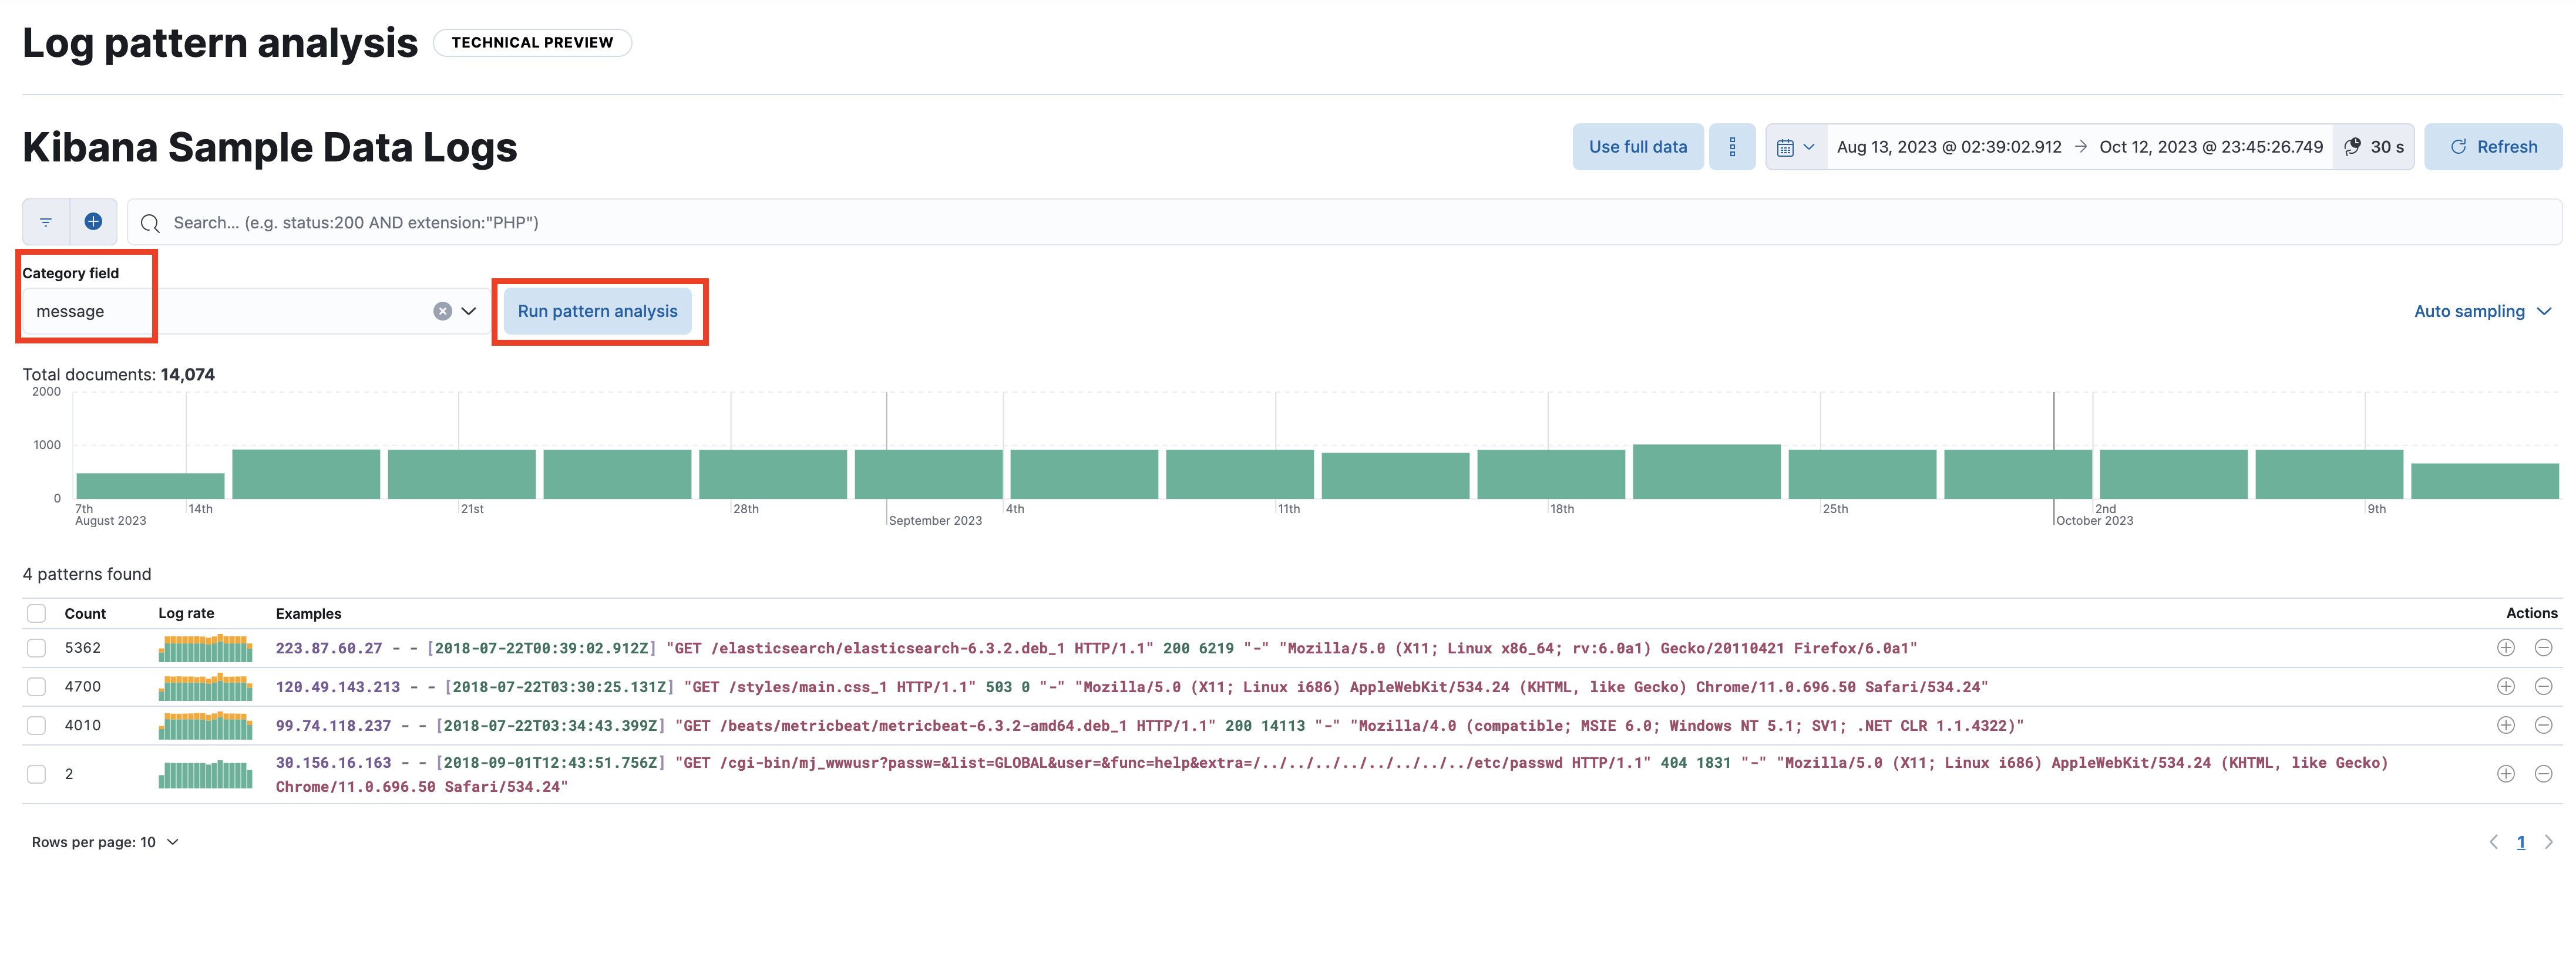
-
Elasticsearch will create a categorization from the unstructured "
message" field. You can further analyze the category by clicking on the + or - icon that will send you to Discover with a new filter. -
Open Discover by clicking on the + icon for the first pattern.
Note that this is part of the message among 5632 documents.
Notice that on the top a new filter is created. Click on it and choose Edit Filter. You'll find which pattern has been detected. For this pattern, the query should be: -
Now, let's explore the Change Point Detection. This tool helps you to quickly detect distribution or trend change in your data.
Return to the machine learning section and click Change Point Detection under AIOps Labs. Choose the Kibana Sample Data Flights data view. Make sure to:- Remove any filters from previous steps
- Use full data
-
Update the metric field to use the
DistanceMilesfield (keep theavg) and useDestCountryas the split field.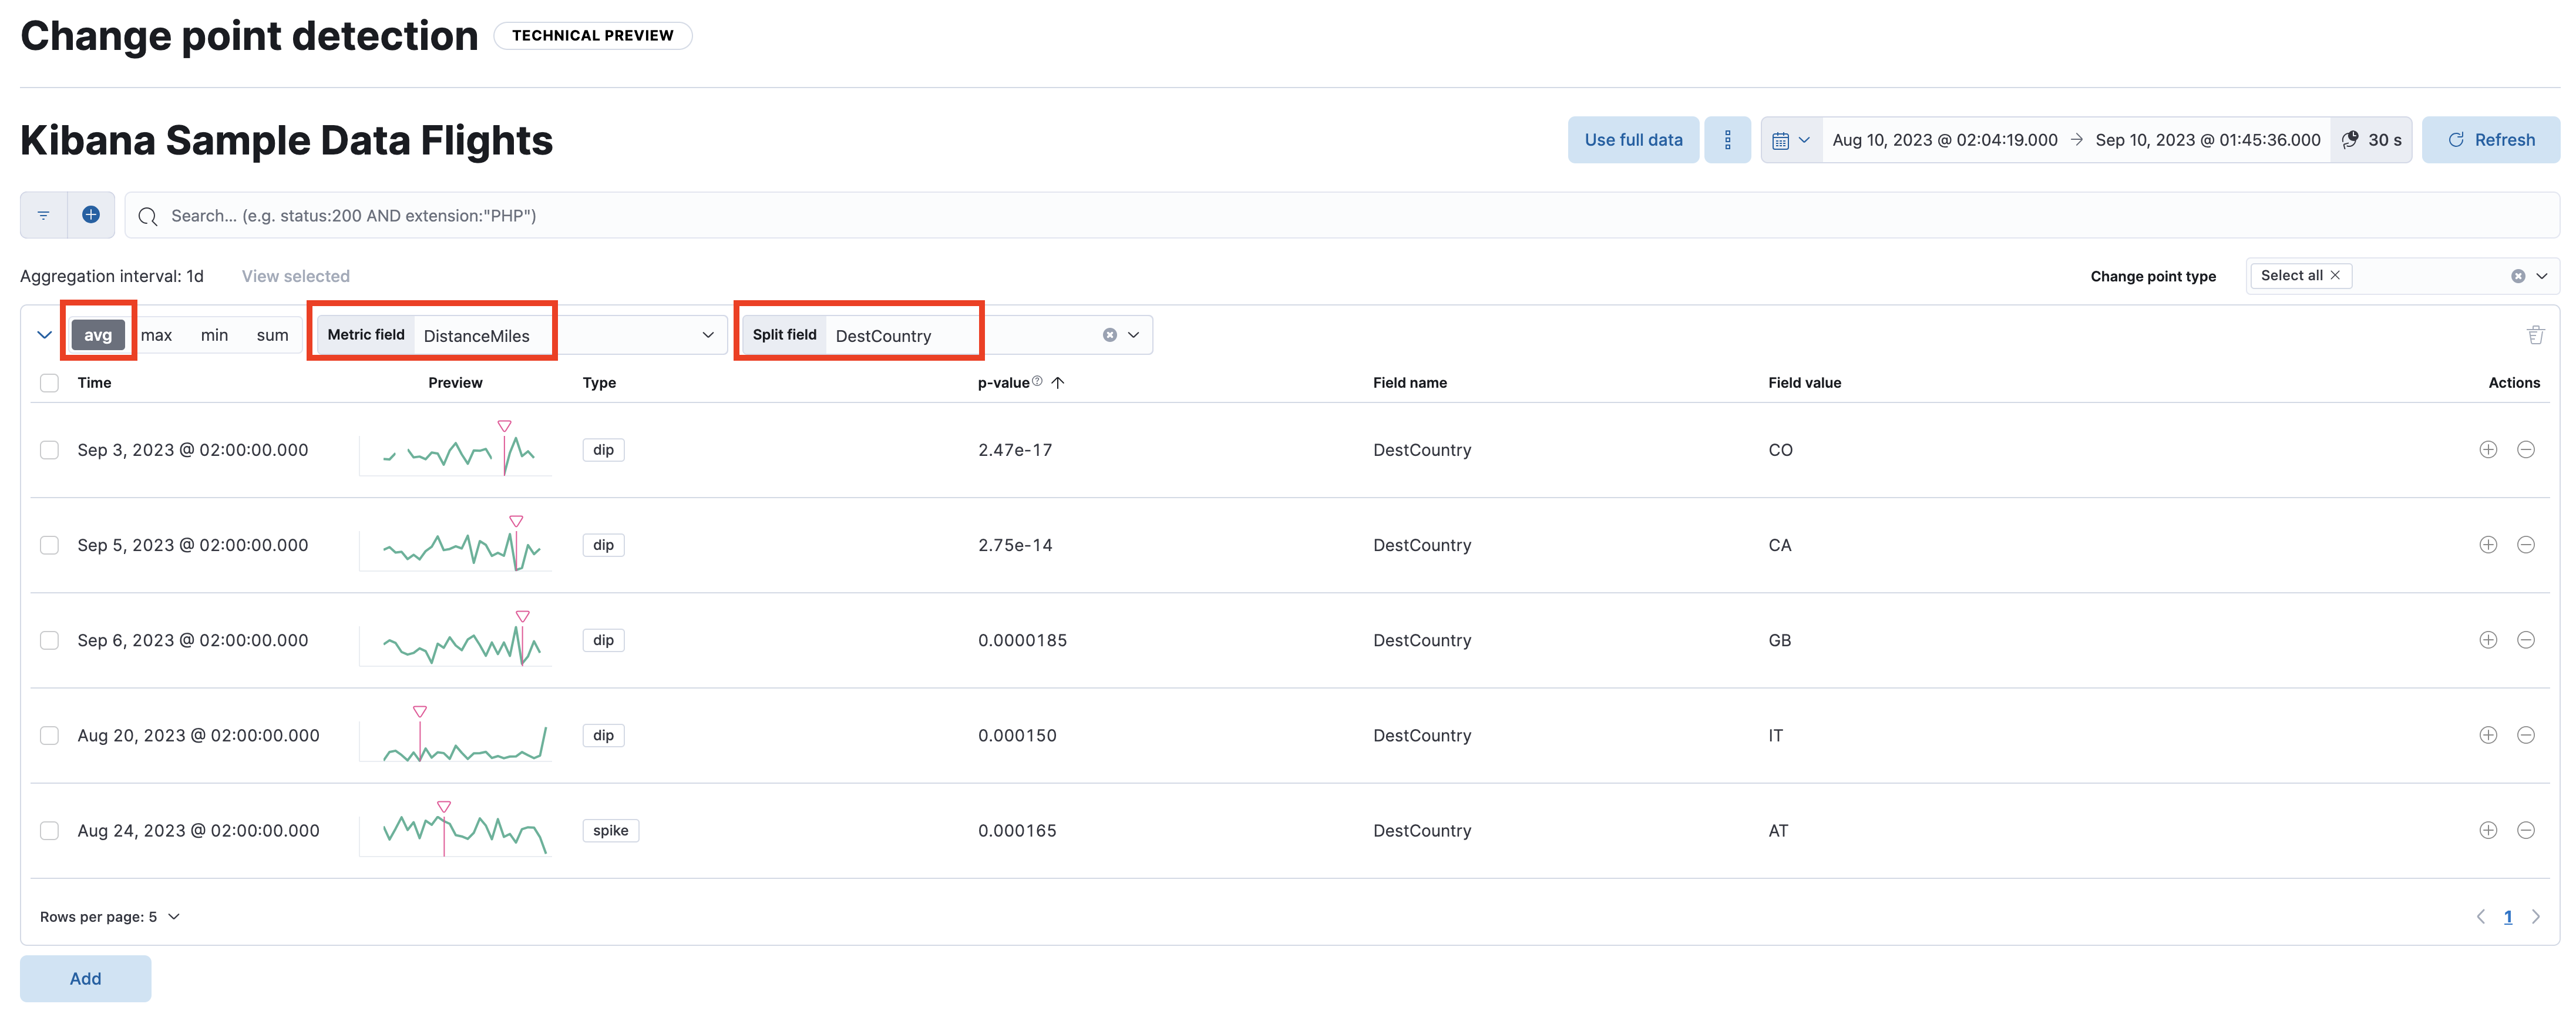
-
You can see that some destinations had a dip in their
DistanceMilesdistribution. Maybe an incident occurred that day.
Summary:
In this lab, you learned how to use AIOps labs to quickly get insights from your data.