1.2: Hello, Dashboard!
Objective:
In this lab, you will create your first Kibana dashboard with a few basic visualizations.
-
In Kibana, open the Dashboard editor by clicking on:
- > Analytics > Dashboard
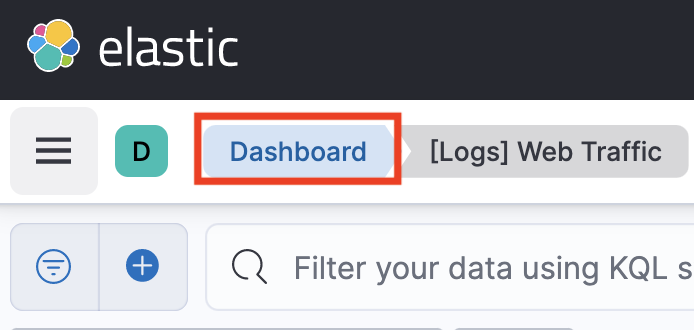
The editor might open the "[Logs] Web Traffic" dashboard. If it happens, click Dashboard in the breadcrumbs, otherwise go to step 2.
-
Click Create dashboard.
-
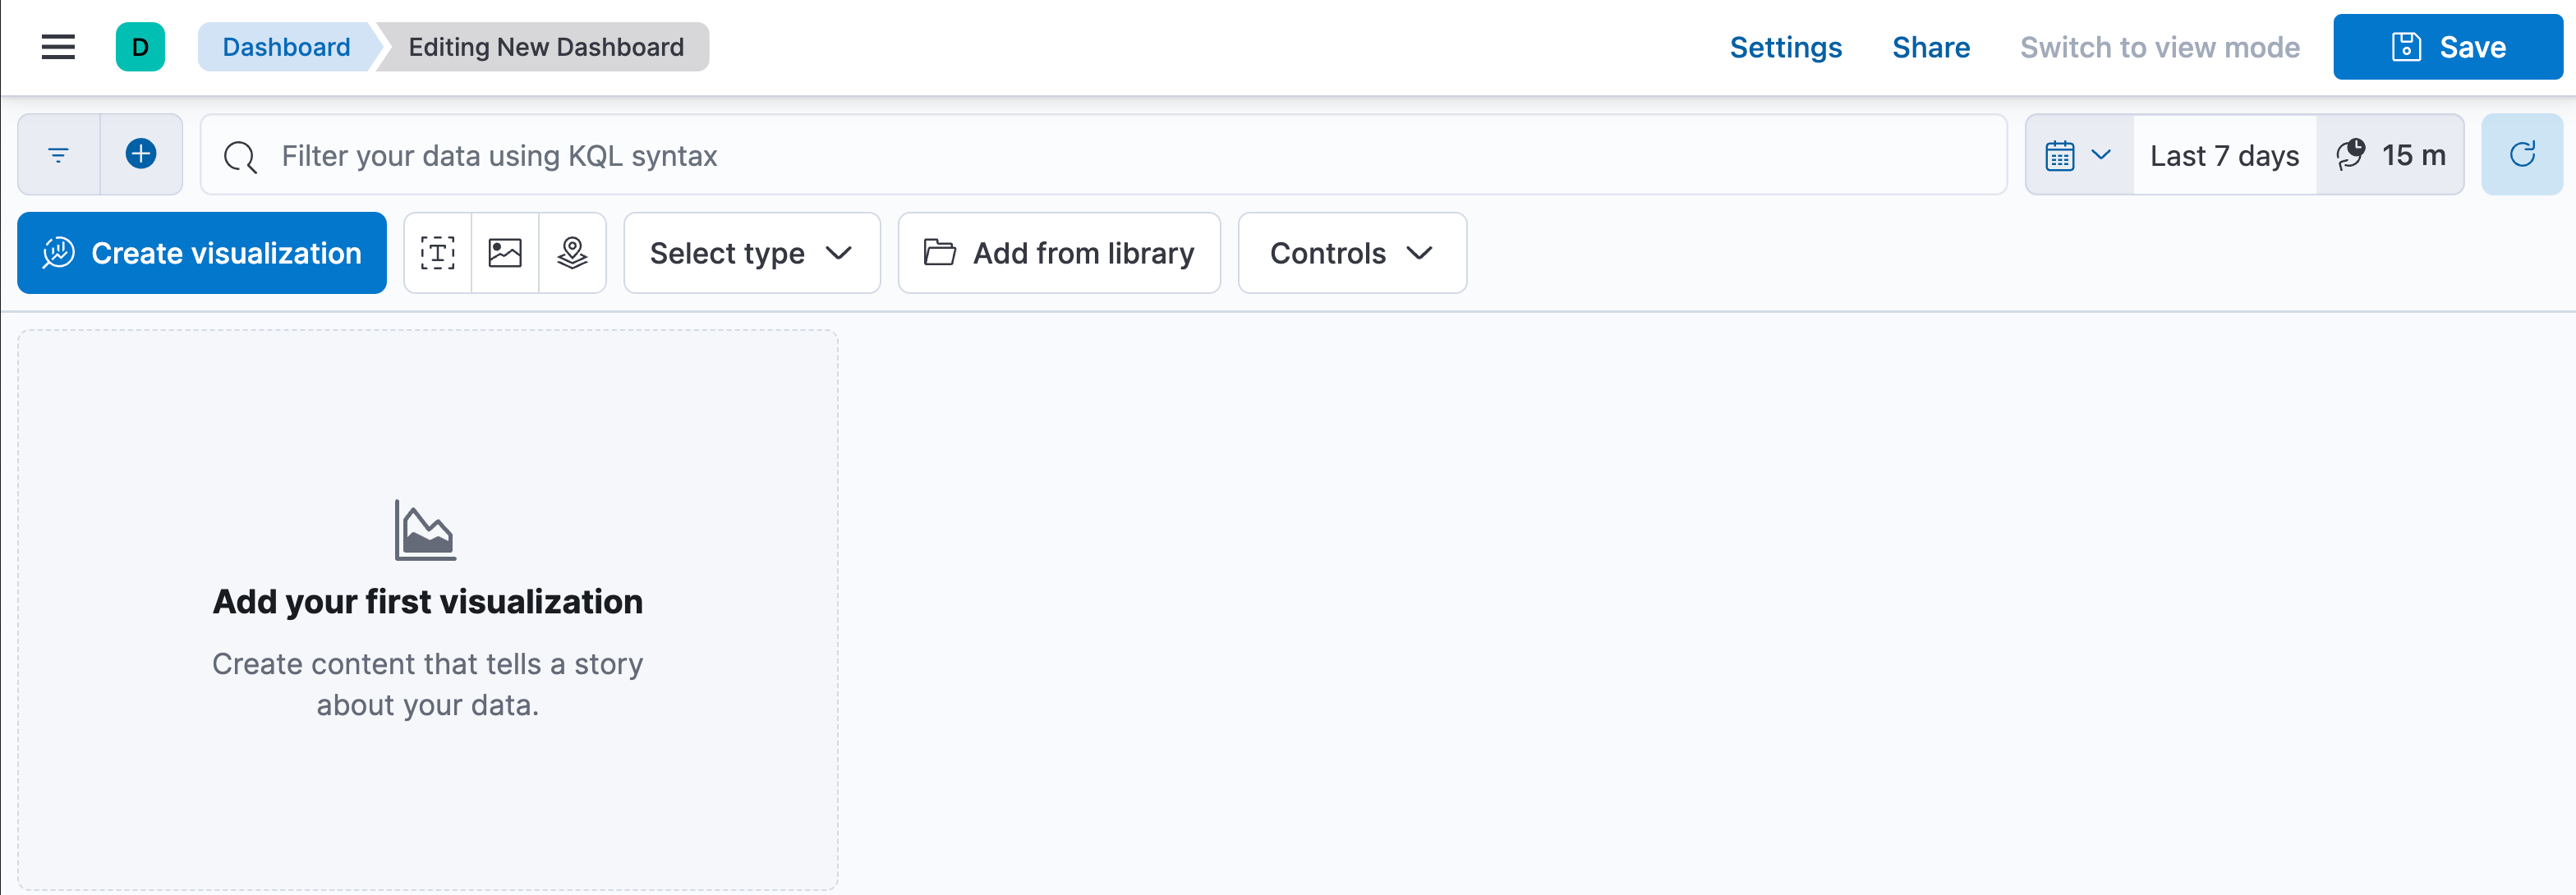
Start your first panel by clicking Create visualization. This will take you to the Lens visualization editor.
-
Before you do anything in Lens make sure you have selected the correct data view and time filter range. If not already specified, select the
Kibana Sample Data Logsdata view and set the time filter to "Last 7 days".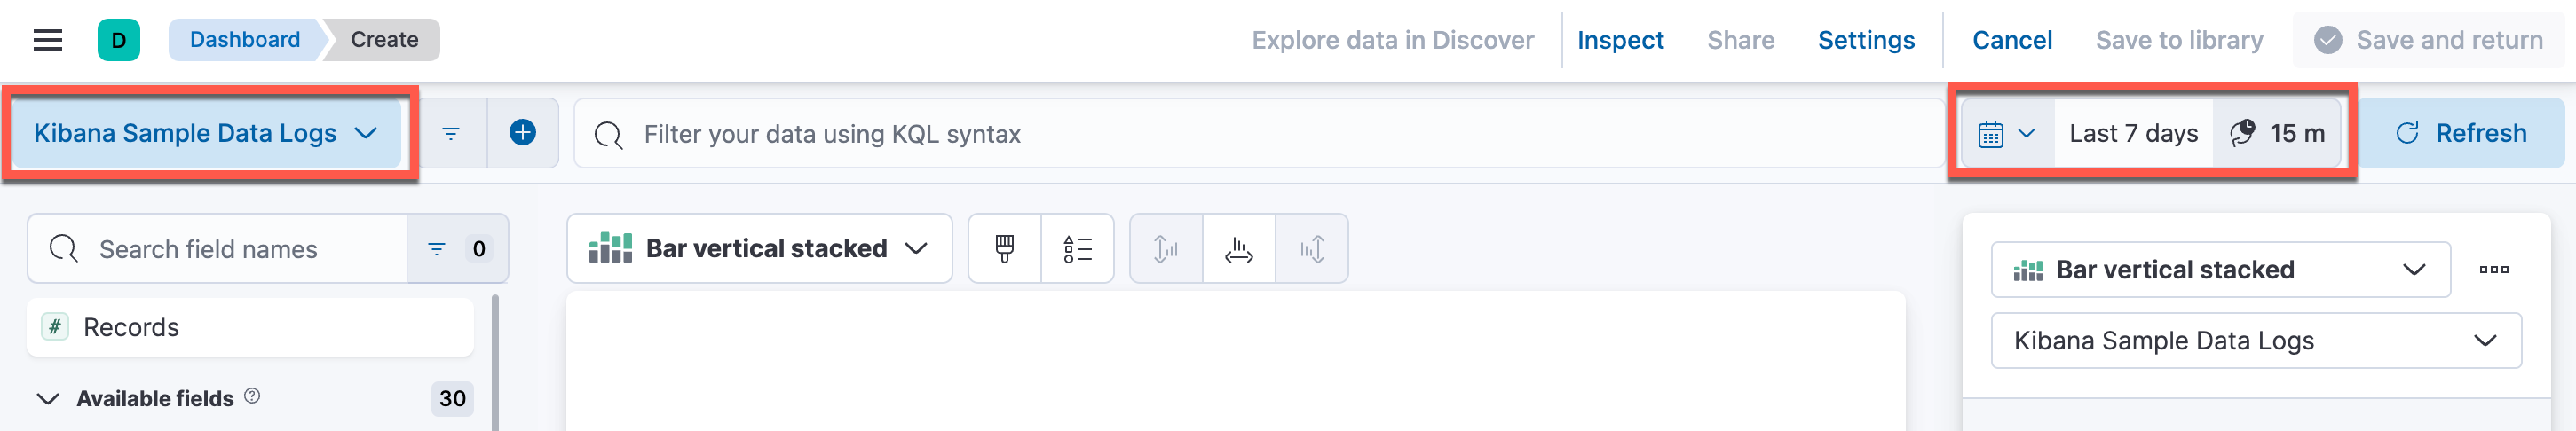
-
Drag and drop the
Recordsfield (from the fields list on the left) into the workspace (at the center).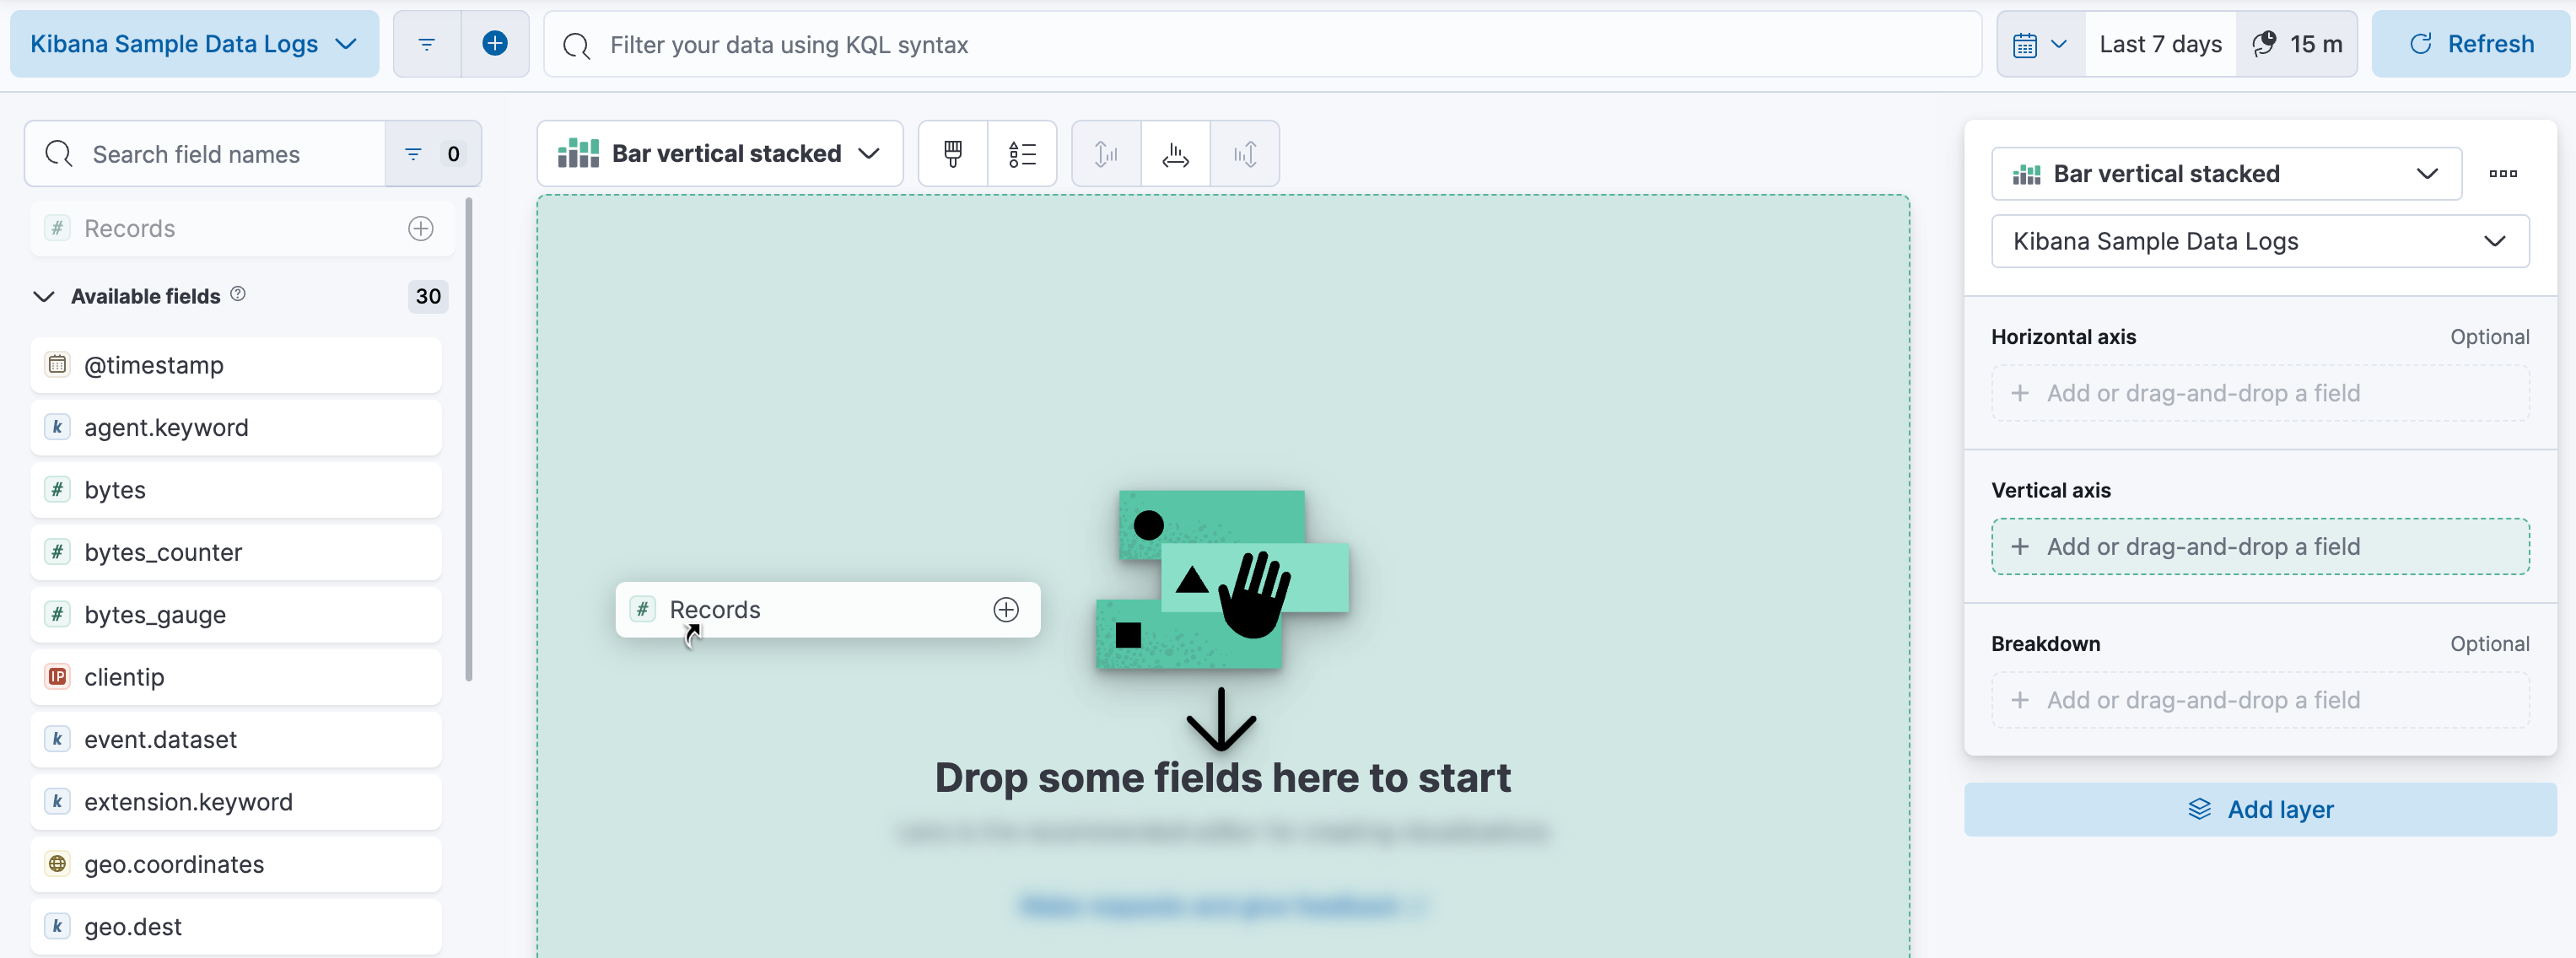
-
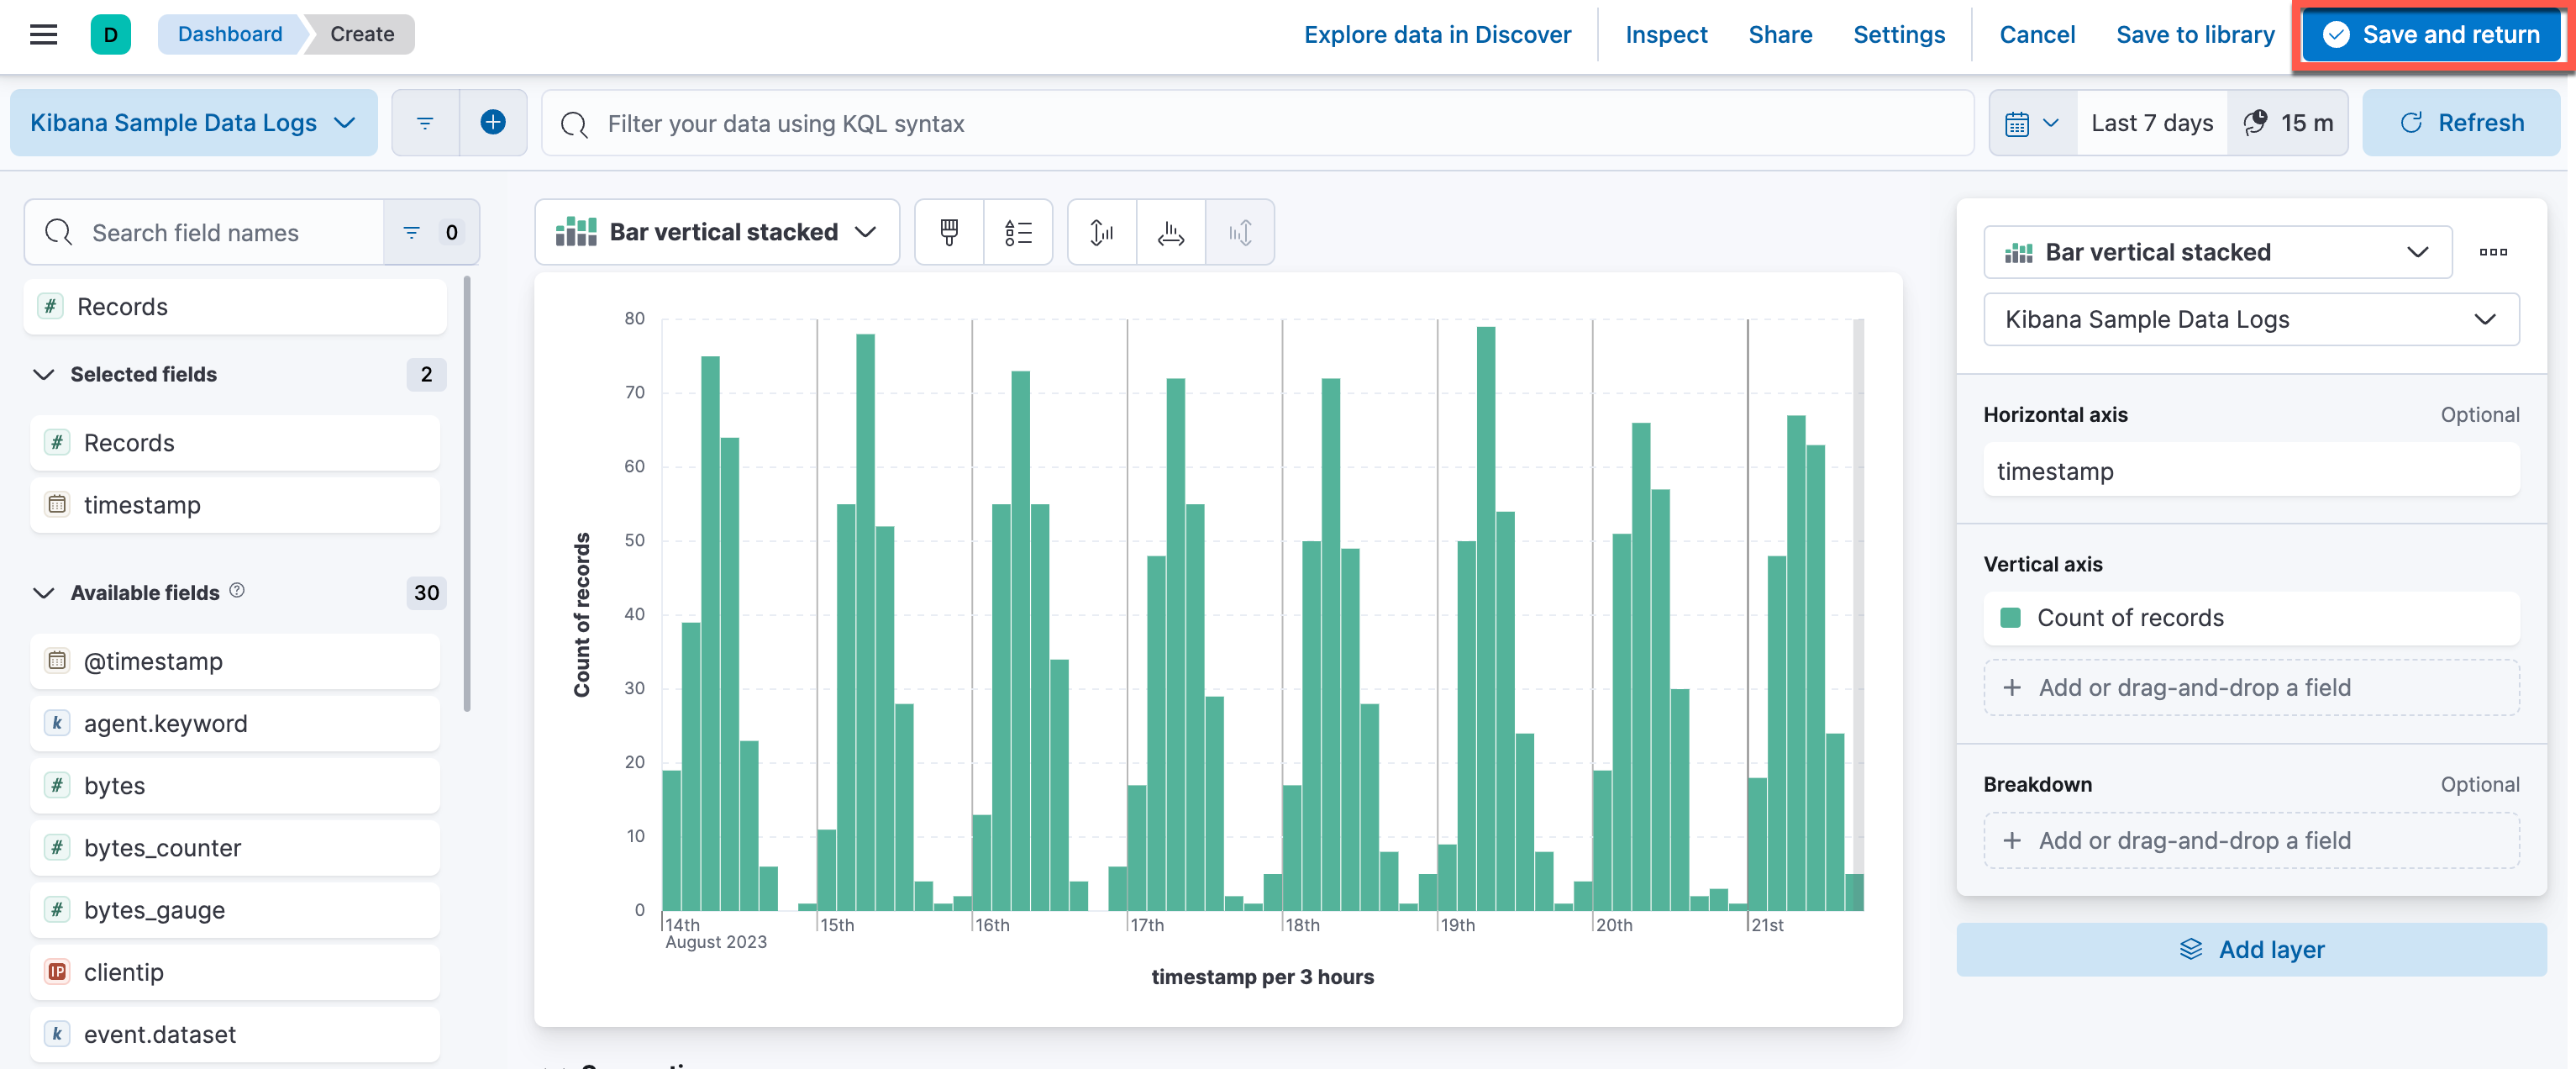
You should now see a vertical bar chart. Click Save and return to return to the dashboard.
-
Your dashboard now has a bar chart! Let's add another visualization. Click Create visualization again.
-
This time drag and drop the field
machine.os.keyword. You can find the field by scrolling down the field list or (partially) typing in the field name in the search bar.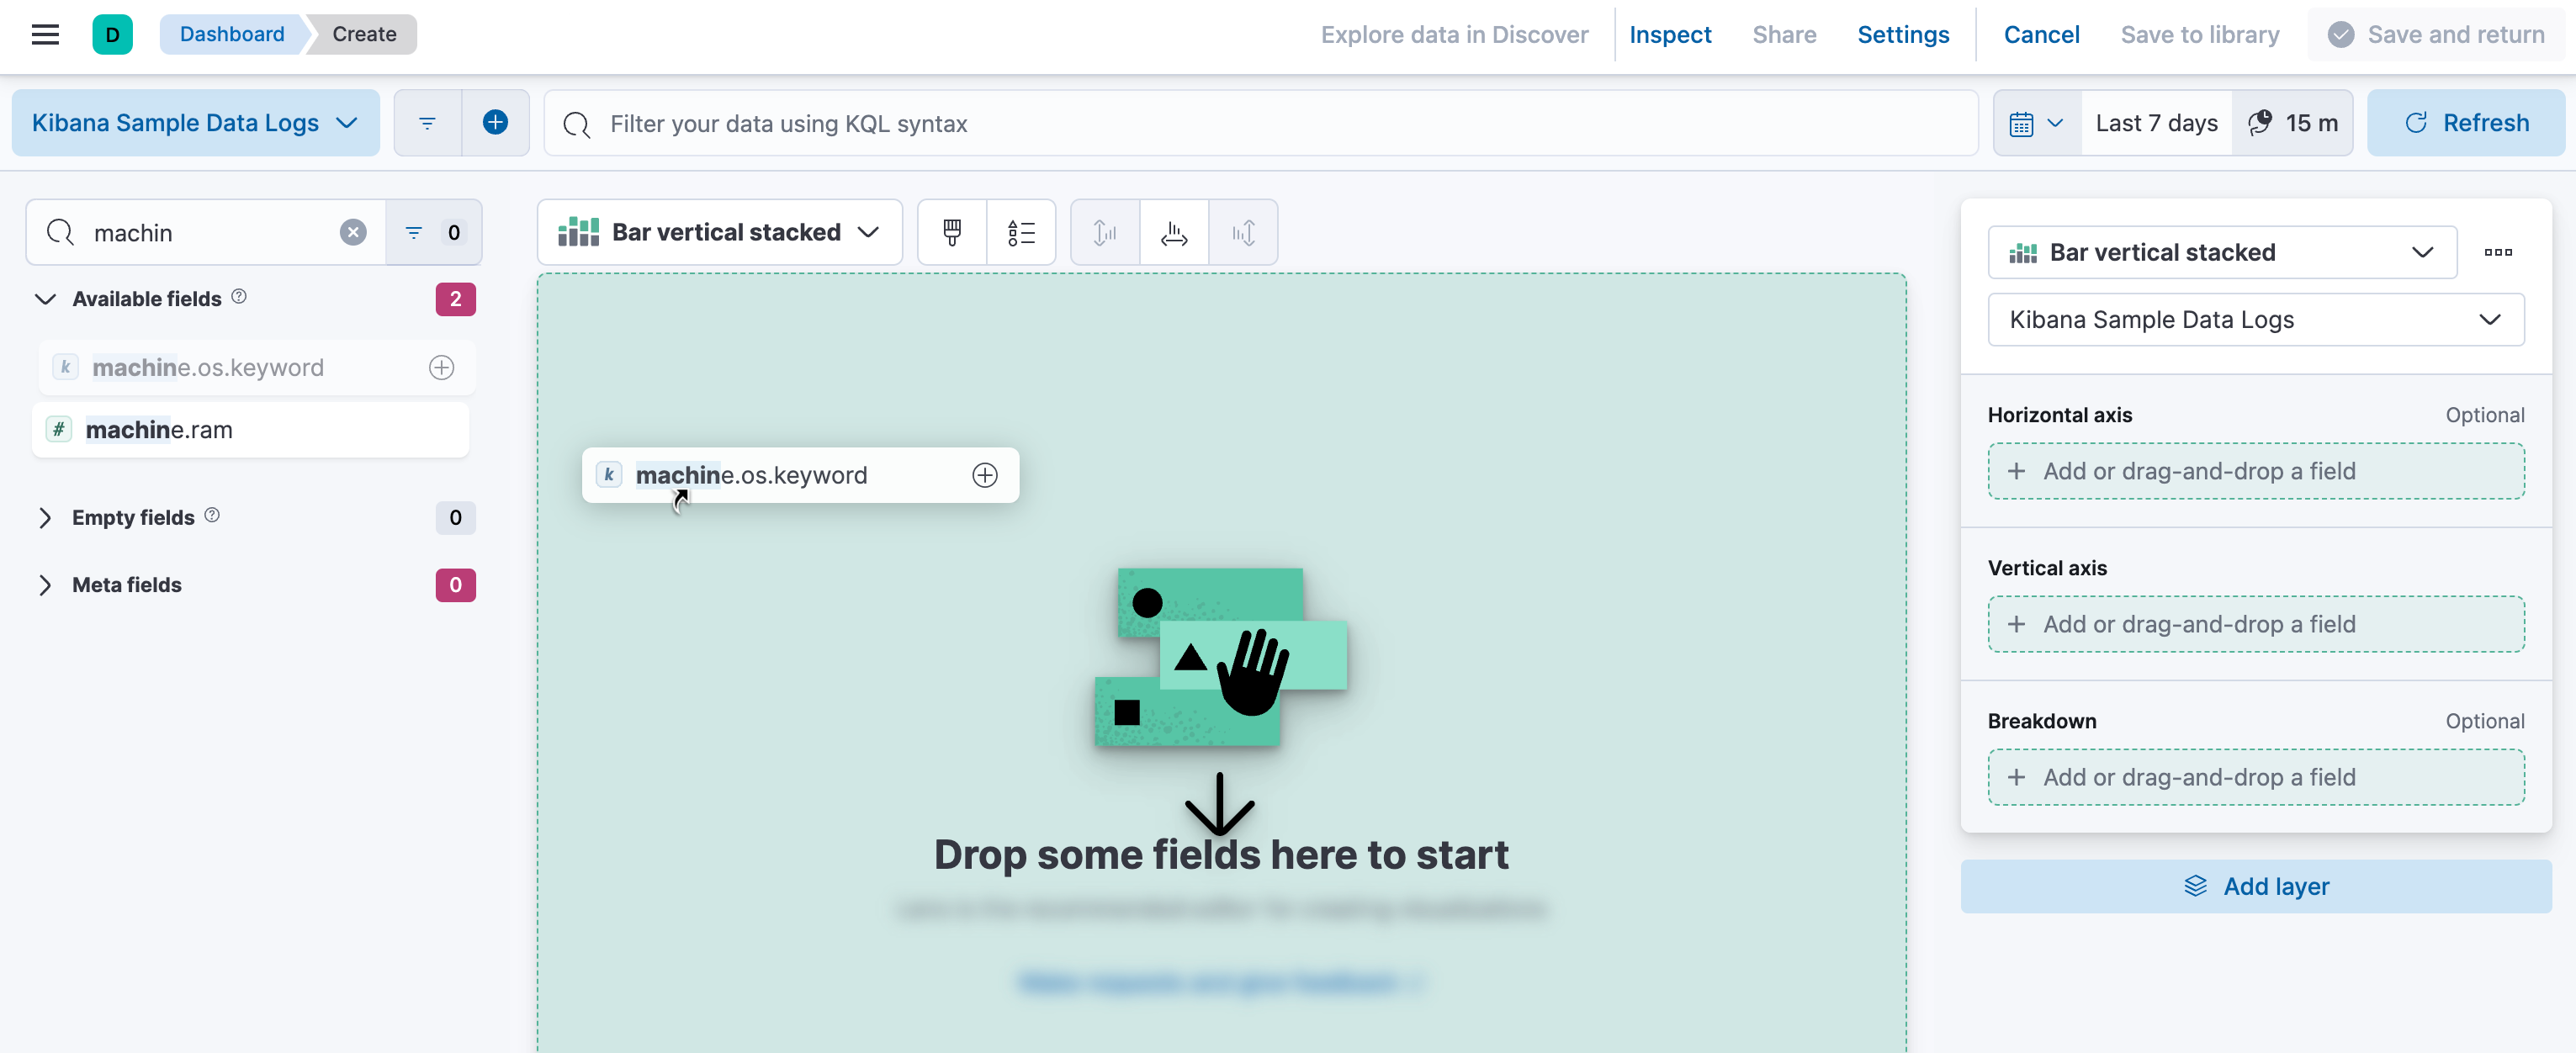
-
Change the visualization to a donut chart. You can change the visualization type using the drop down menu or select it from the Suggestions at the bottom. Click Save and return to go back to the dashboard.
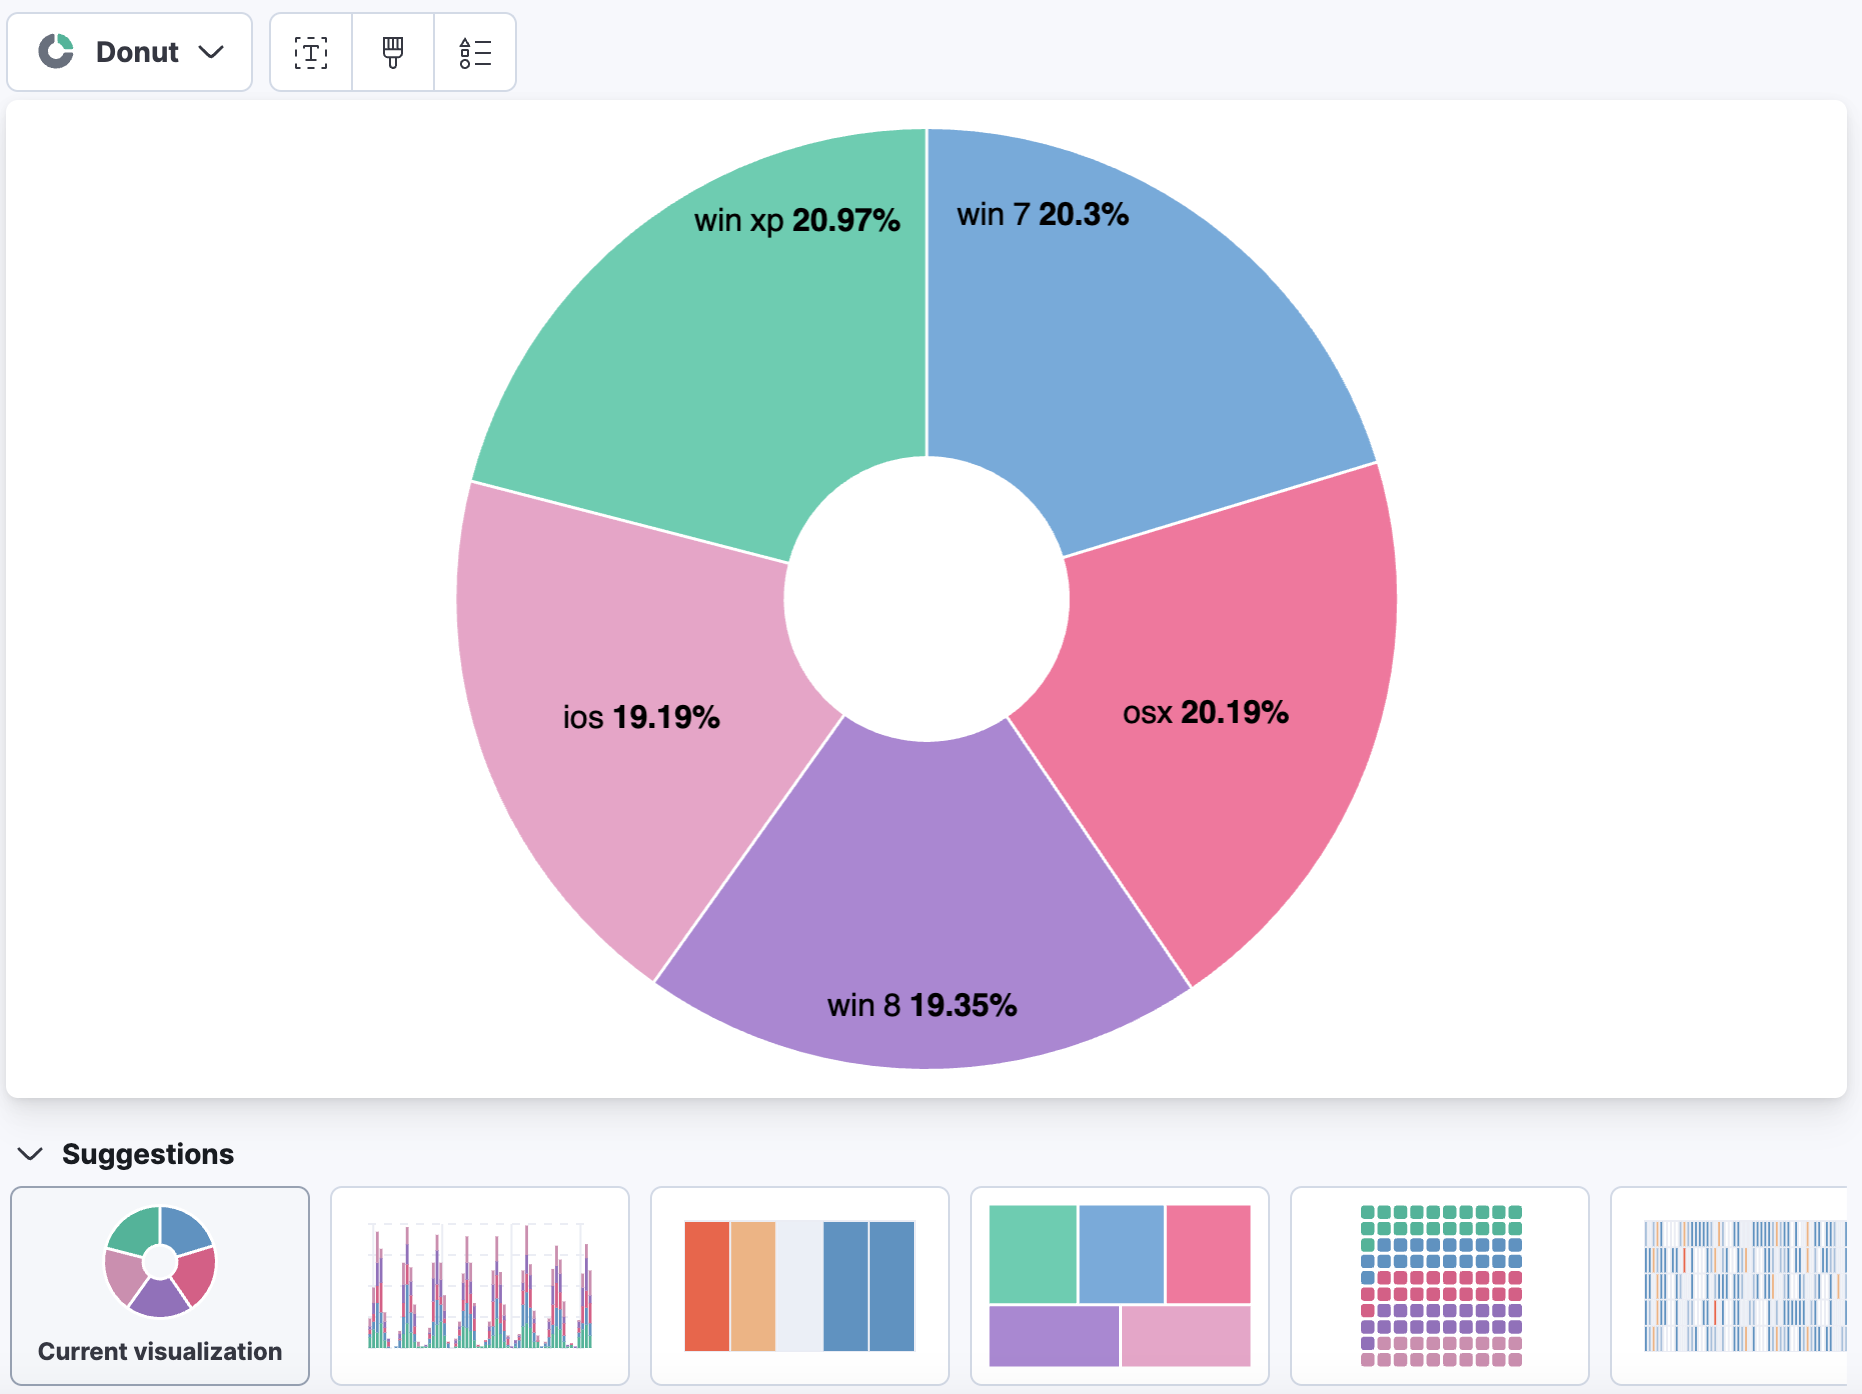
Donut charts and pie charts are useful to visualize distribution of categorical data where you want to show something to be a part of a whole. This donut chart shows the distribution of five Operating Systems used by the visitor to our website. A single stack bar chart can also be used as an alternative to a donut or pie chart. Sometimes it may be easier to judge the distribution better in a bar chart simply because length is used instead of area.
-
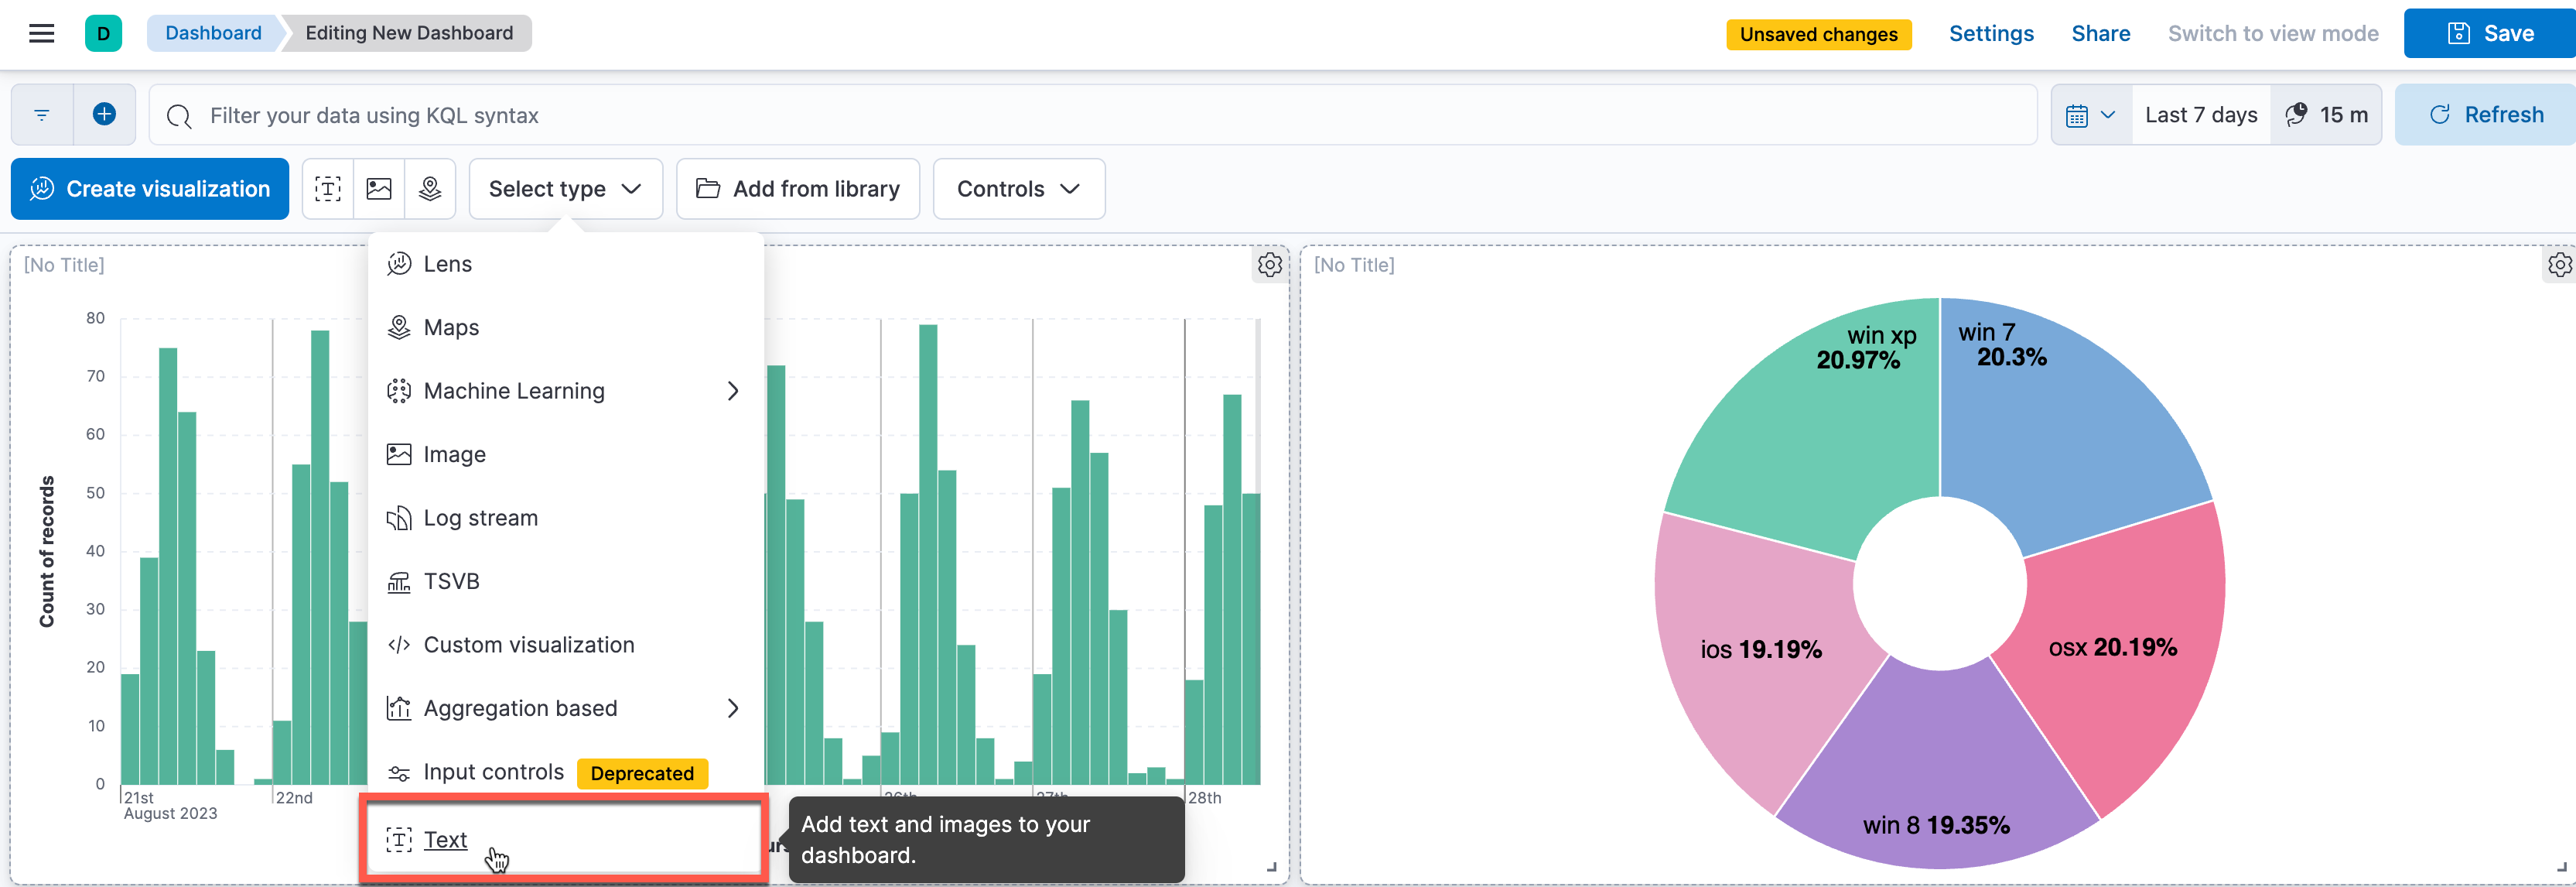
Next try using a different visualization editor. Let's create a text description. Later we can use this in more creative ways. For now we will just include a short description.
Select the text editor. There are two ways to do this: click the "T" icon next to Create visualization or click the drop-down menu Select type and select Text.
-
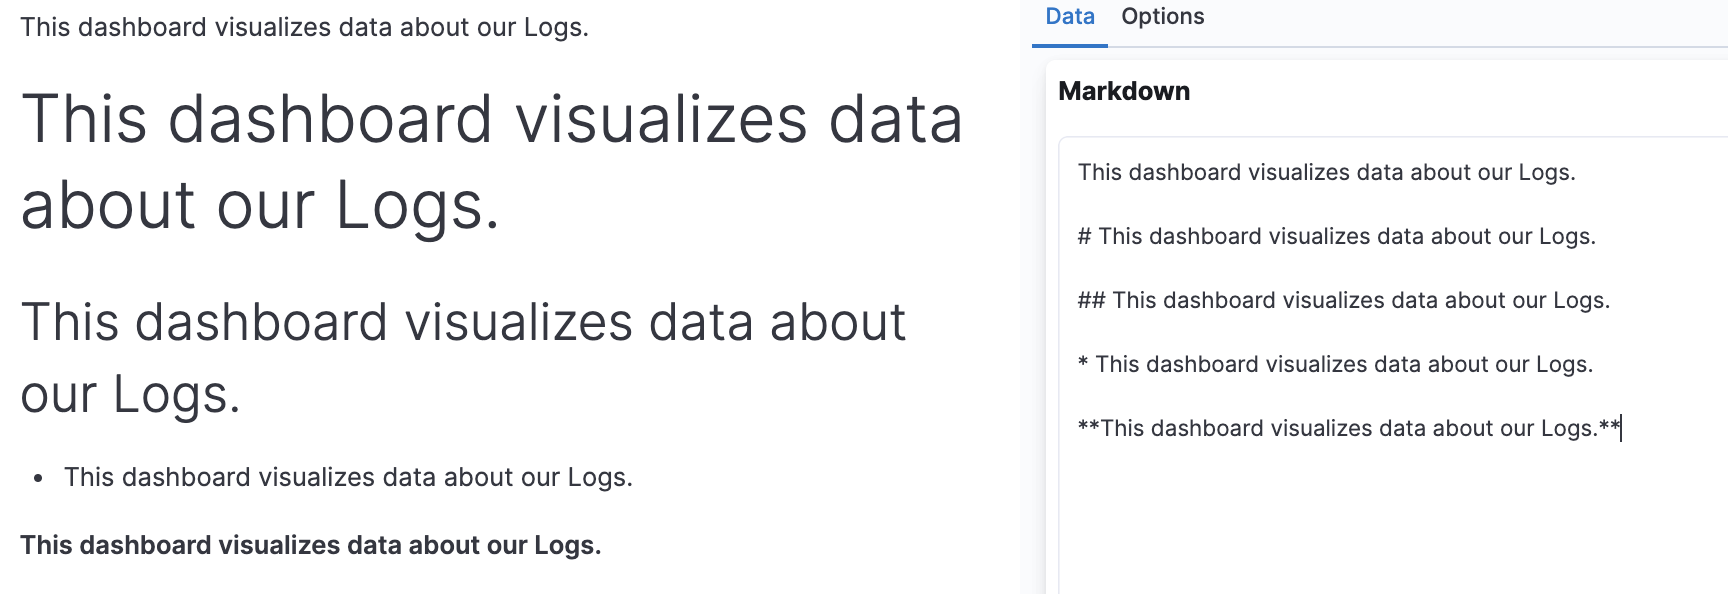
In the editor, type a short description, such as "This dashboard visualizes data about our Logs". You can use Markdown syntax to change the formatting of your text. See some examples below. Don't forget to click Update before you Save and return.
-
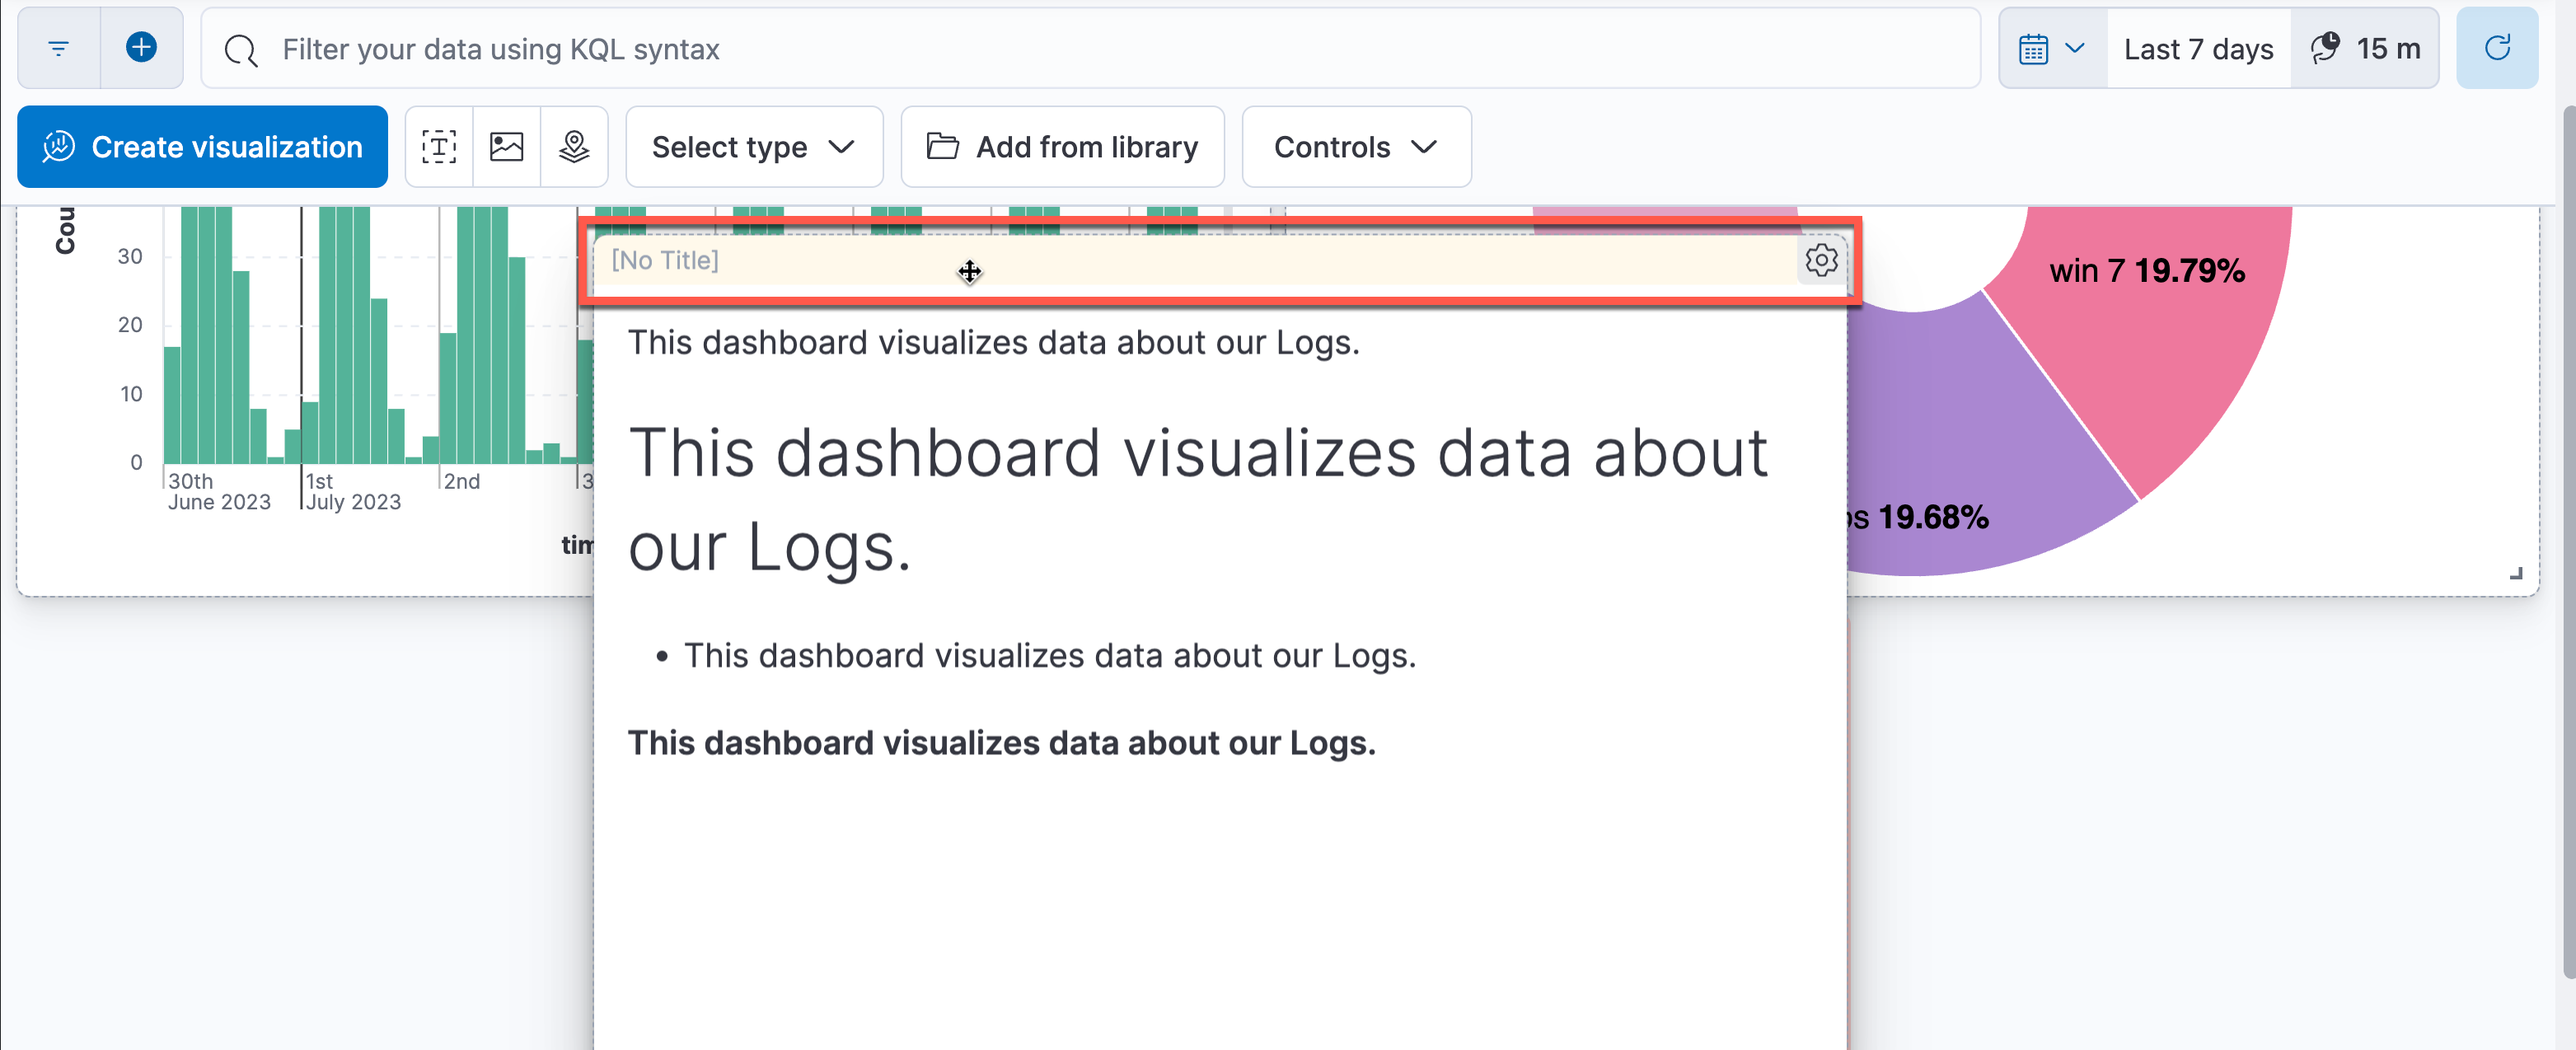
You can rearrange your panels by click on the top border of the panel – again when you hover your mouse over the top border, the color of the top part of the panel changes slightly and your cursor shape changes.
-
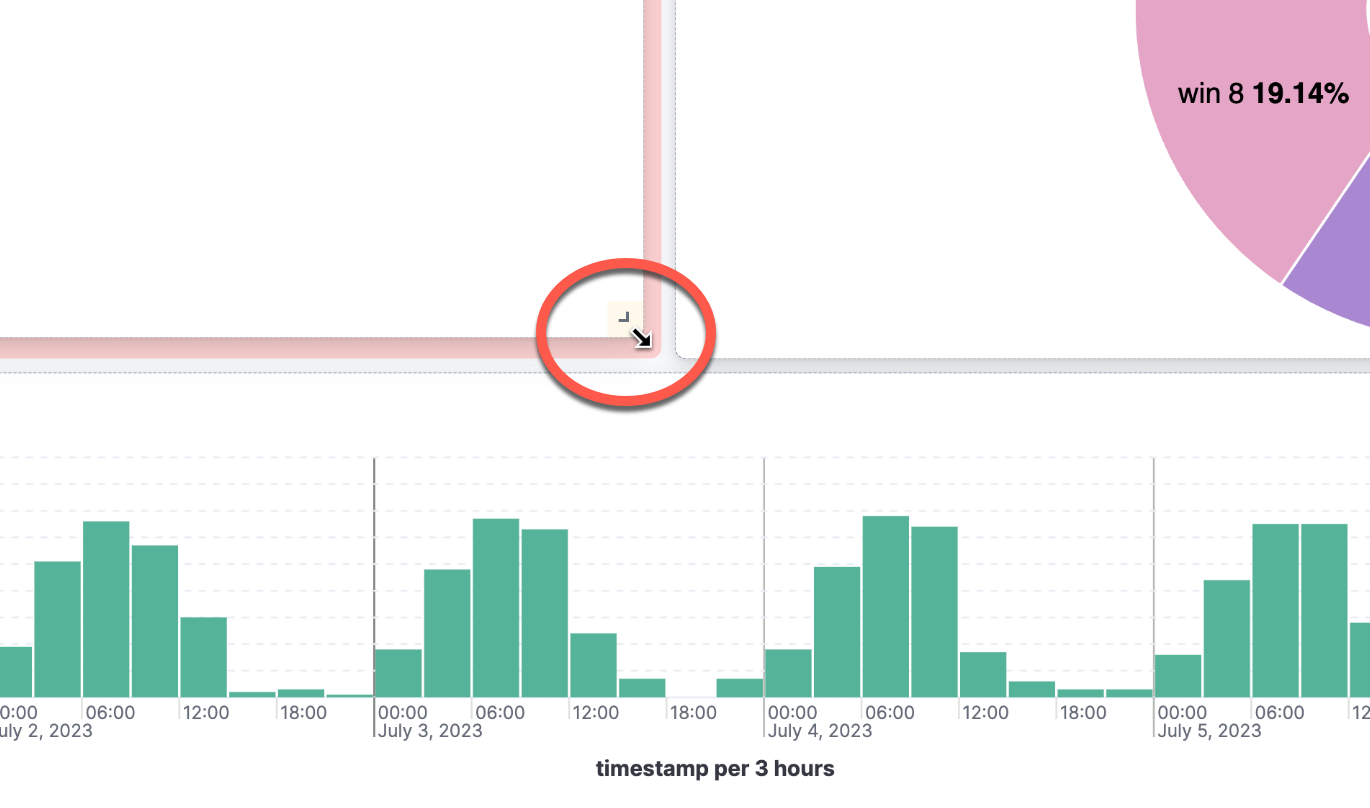
Now let's make your dashboard look nice. You can easily resize your panels by clicking the bottom right corner and dragging it – notice that when you hover your mouse over the bottom right corner, the color of the corner changes slightly and your cursor shape changes.
-
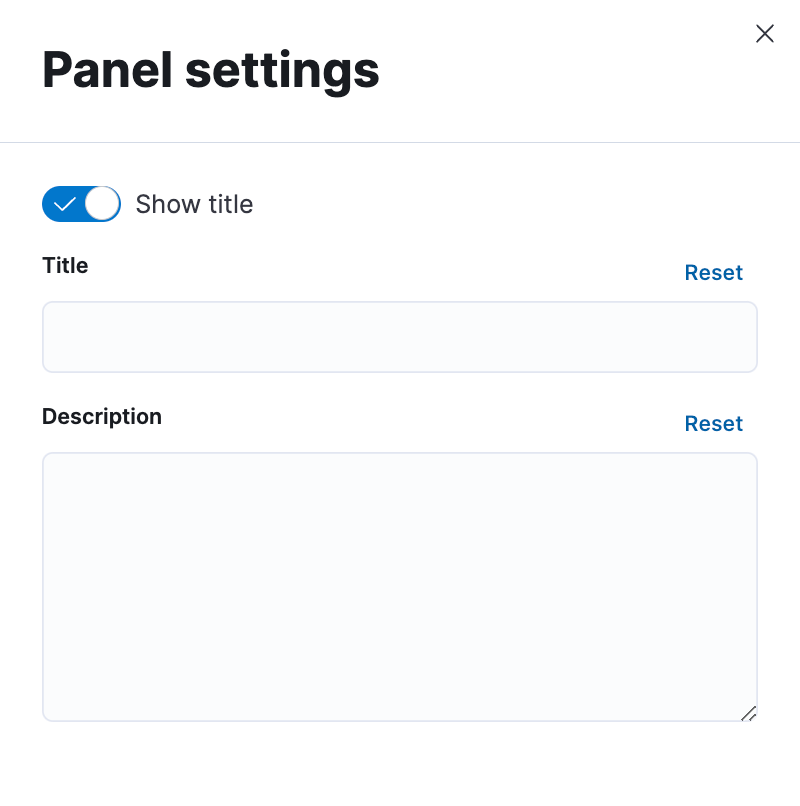
You can click on "[No Title]" to open a flyout from the right that allows you to change the title and description of your panel. Click Save to save your changes.
-
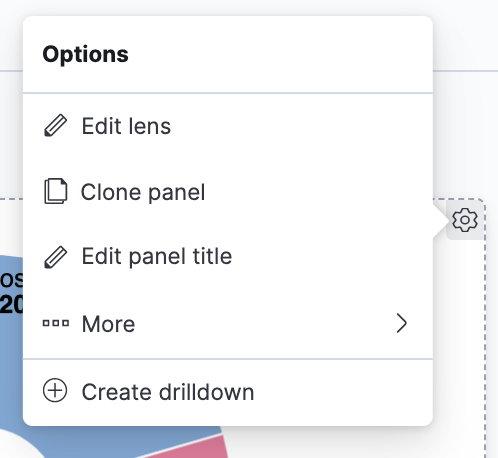
You can also click on the panel options (the gear symbol on the top right corner) and select Edit panel title. Enter a suitable name for the panel.
-
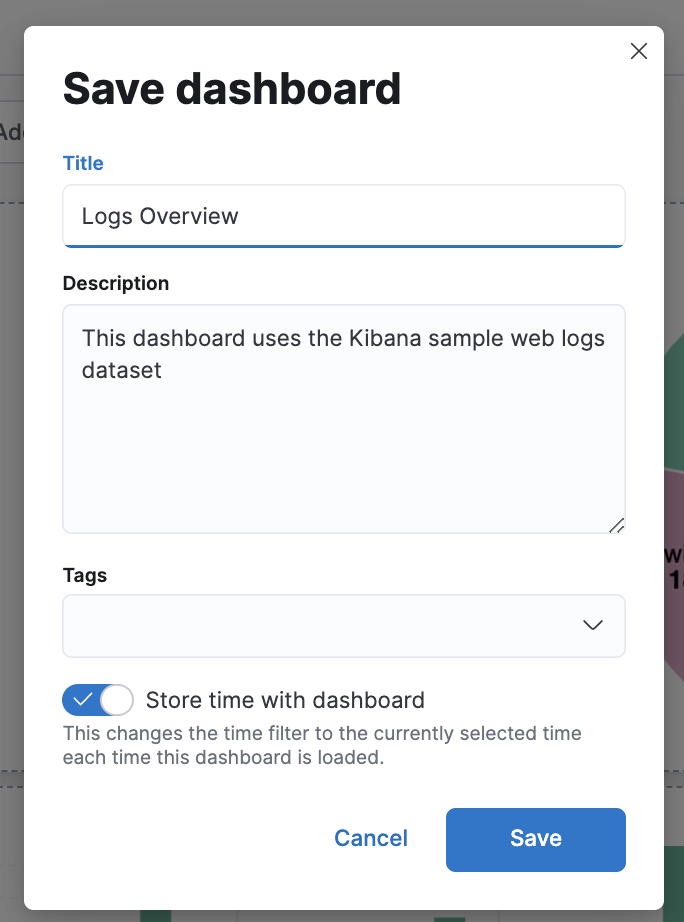
Once you have chosen a configuration you're happy with Save your dashboard. Dashboard names should be descriptive. Let's call it "Logs Overview". You can include a description if you want. If you want to store the currently set time filter range with your dashboard, enable Store time with dashboard. Take a look at your time filter before you do this so that you save the time range you want. "Last 7 days" is a good time range to use.
-
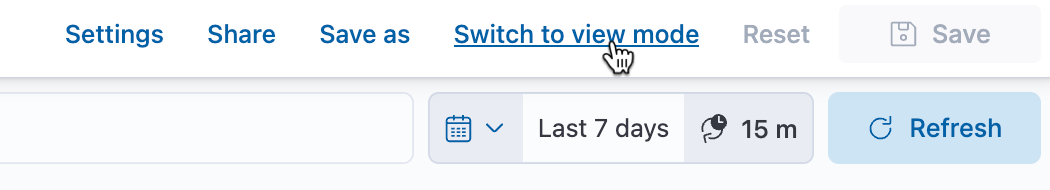
Finally, click Switch to view mode on the toolbar to see your completed dashboard. If you want to make more changes, just click Edit.
Summary:
In this lab, you created a simple dashboard with two charts and one markdown visualization.