4.3: Interactive Dashboards
Objective:
In this lab, you will learn how to create interactive dashboards by adding controls and drilldowns on your dashboards.
-
Open the Logs Overview dashboard.
- Make sure to view the Last 7 days of data.
- Click the Edit button. Note: If the dashboard is already in Edit mode, you'll see a Save button instead.
-
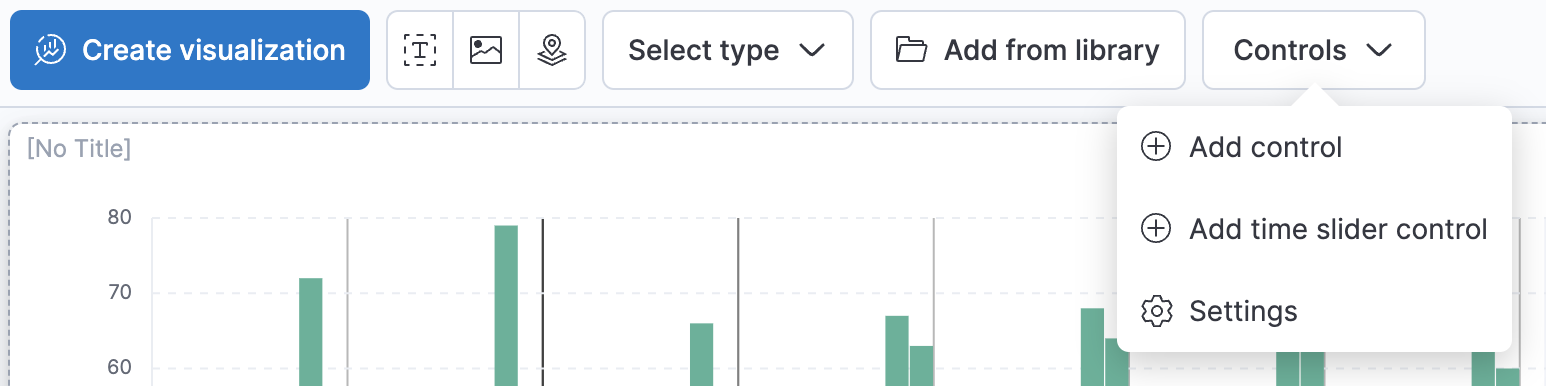
Let's add a control to the dashboard. To create a Control, click the Controls dropdown on the dashboard toolbar and then select Add control. This opens the control creation panel.
-
There are three types of control, Options list, Time slider, and Range slider.
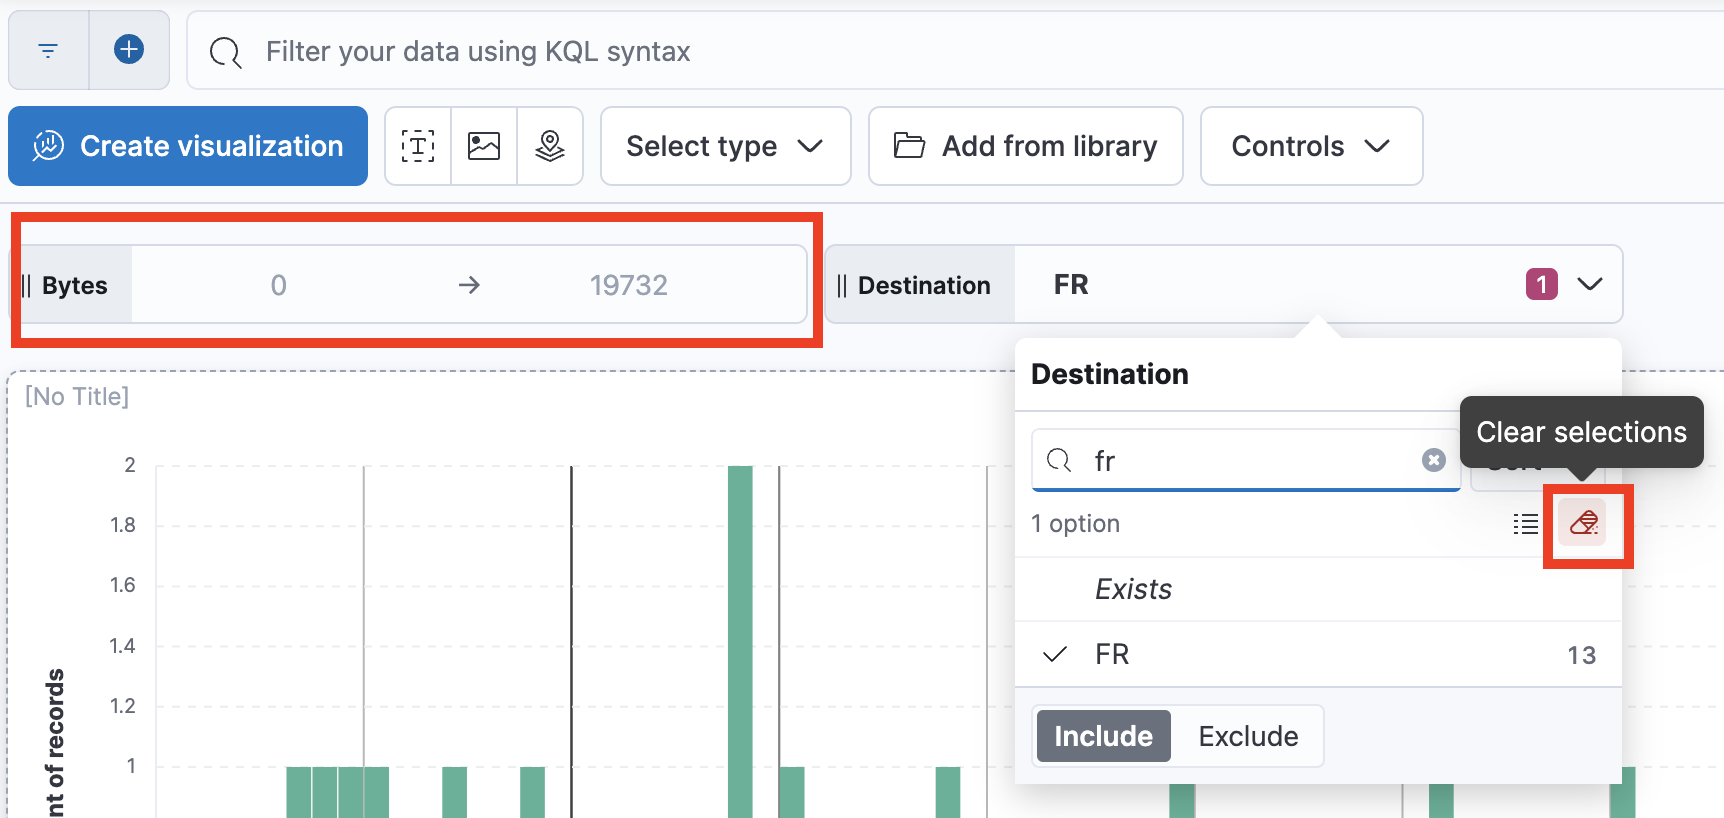
Let's start by adding an Options list. Leave the data view setting as is and select geo.dest in the field list. The control type is automatically selected depending on the field type. Set the label to Destination and Disable Expand width to fit available space and click on Save and close.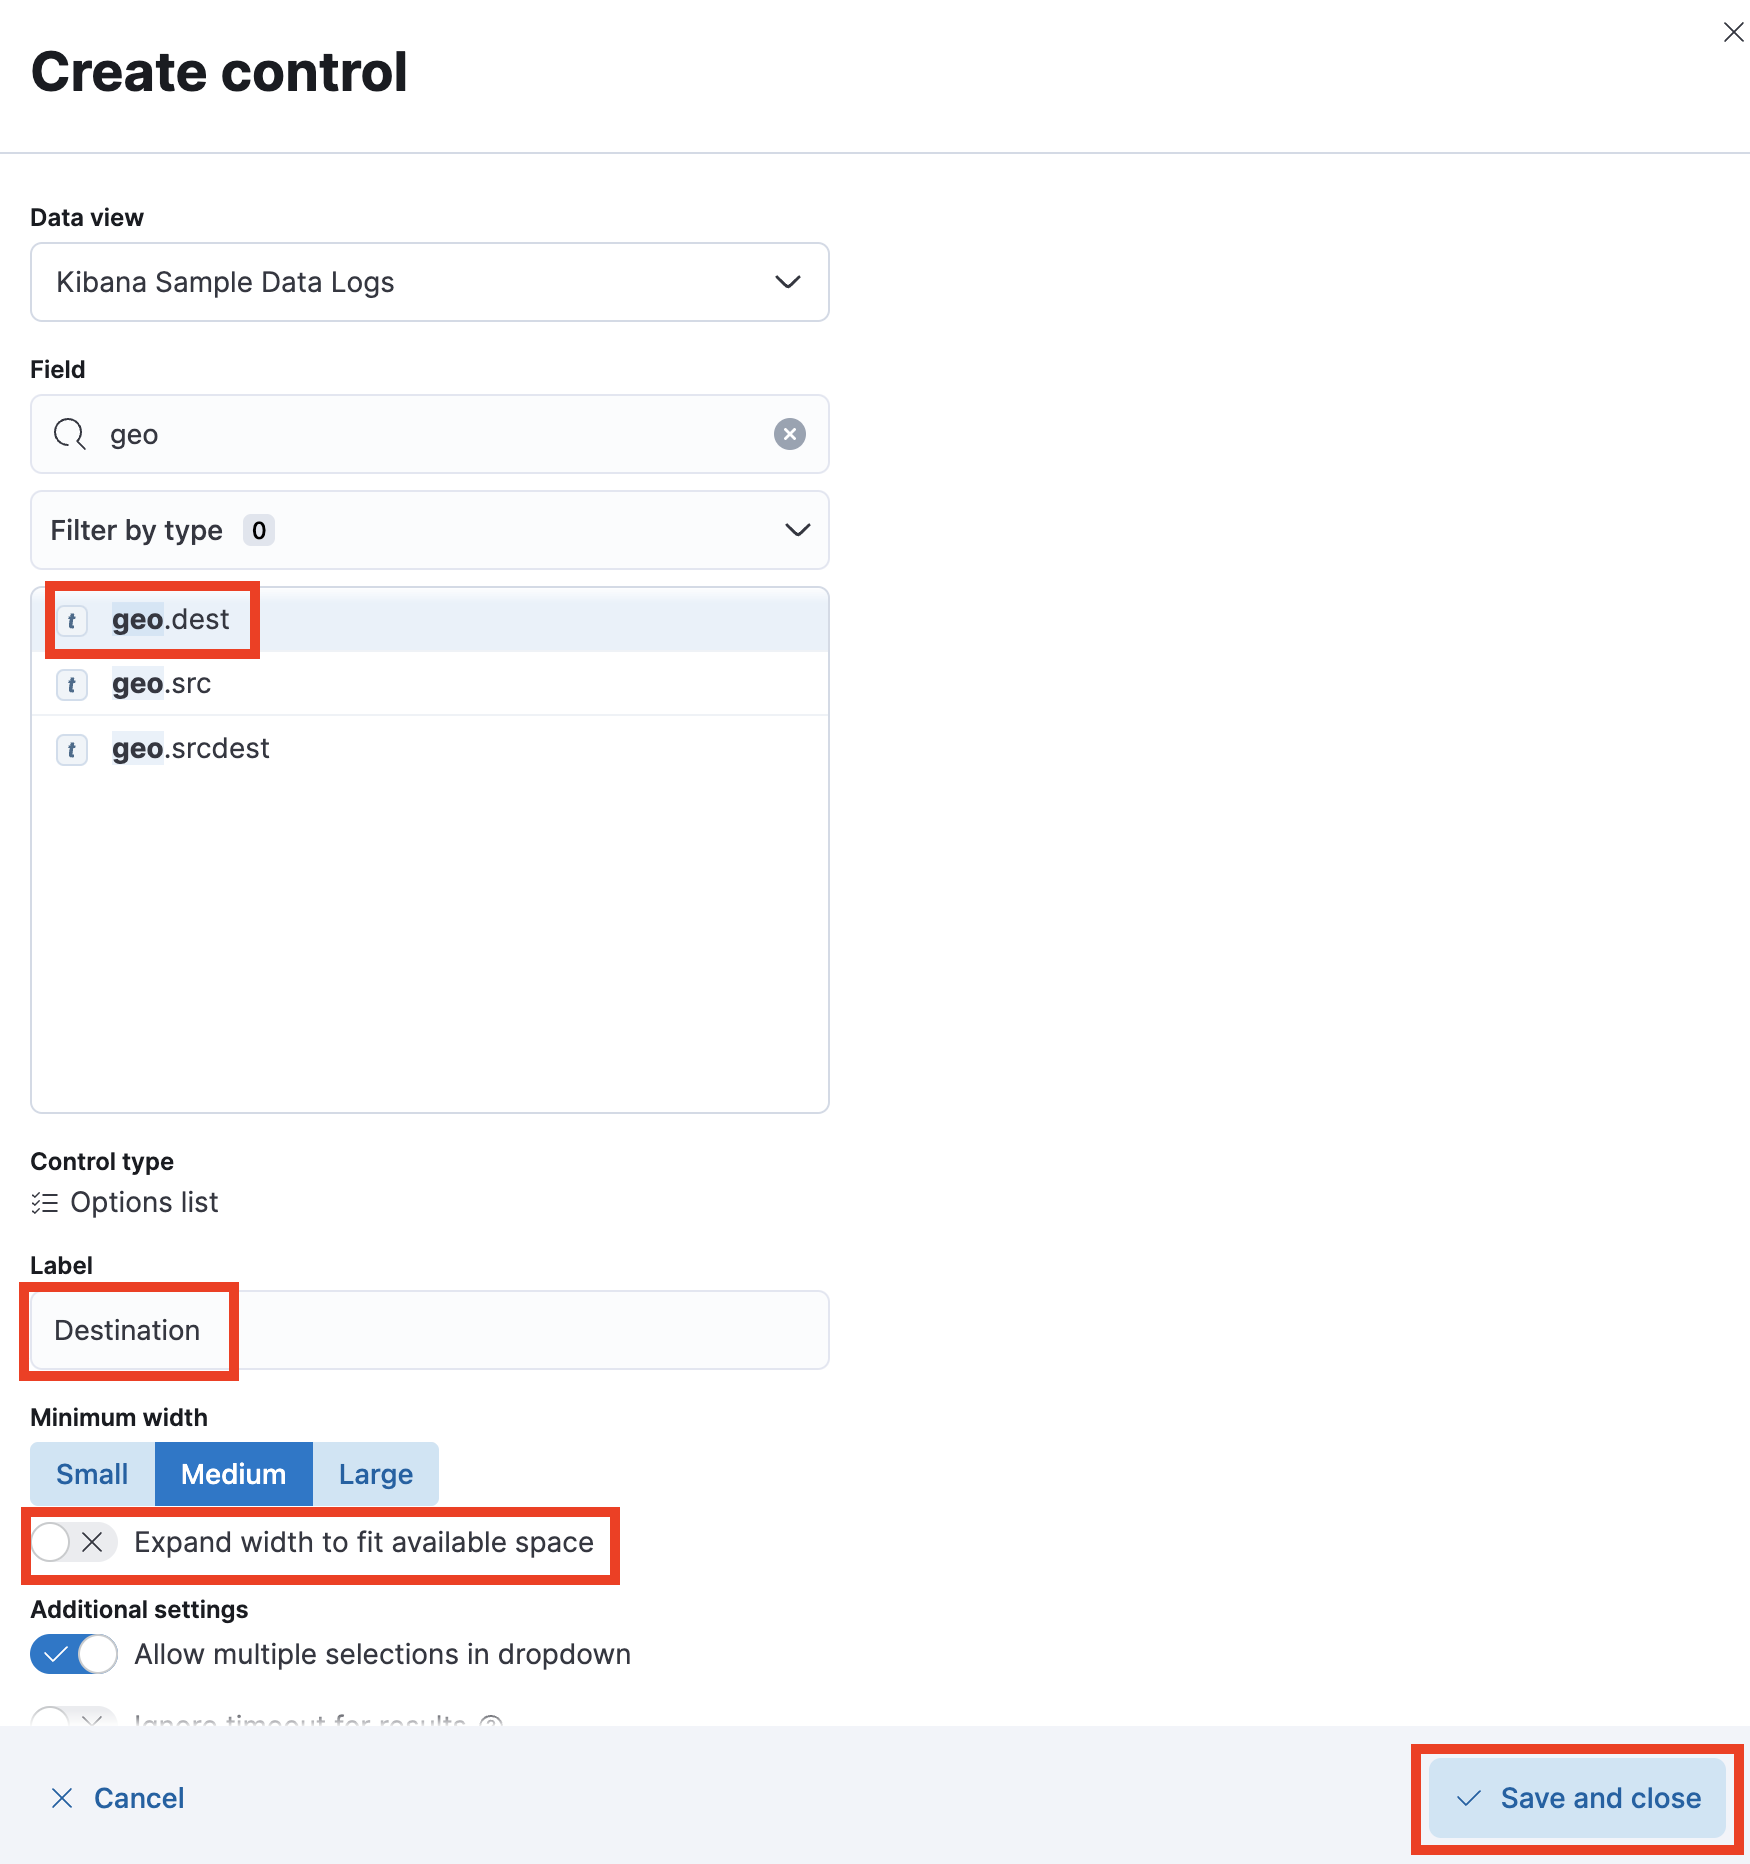
-
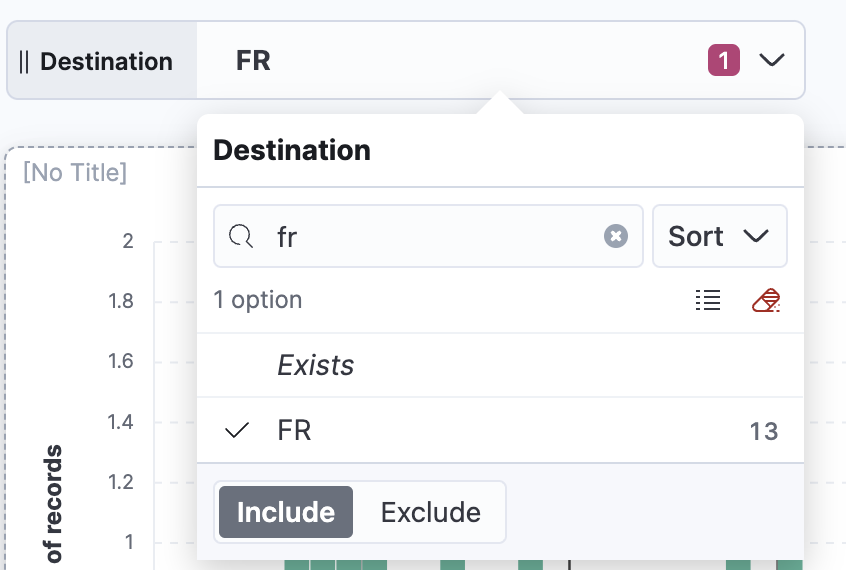
The control will appear now at the top of your dashboard. Click on it and in the value search menu type fr to see that it will update the list of available entries. Select the only entry provided, for the FR destination.
-
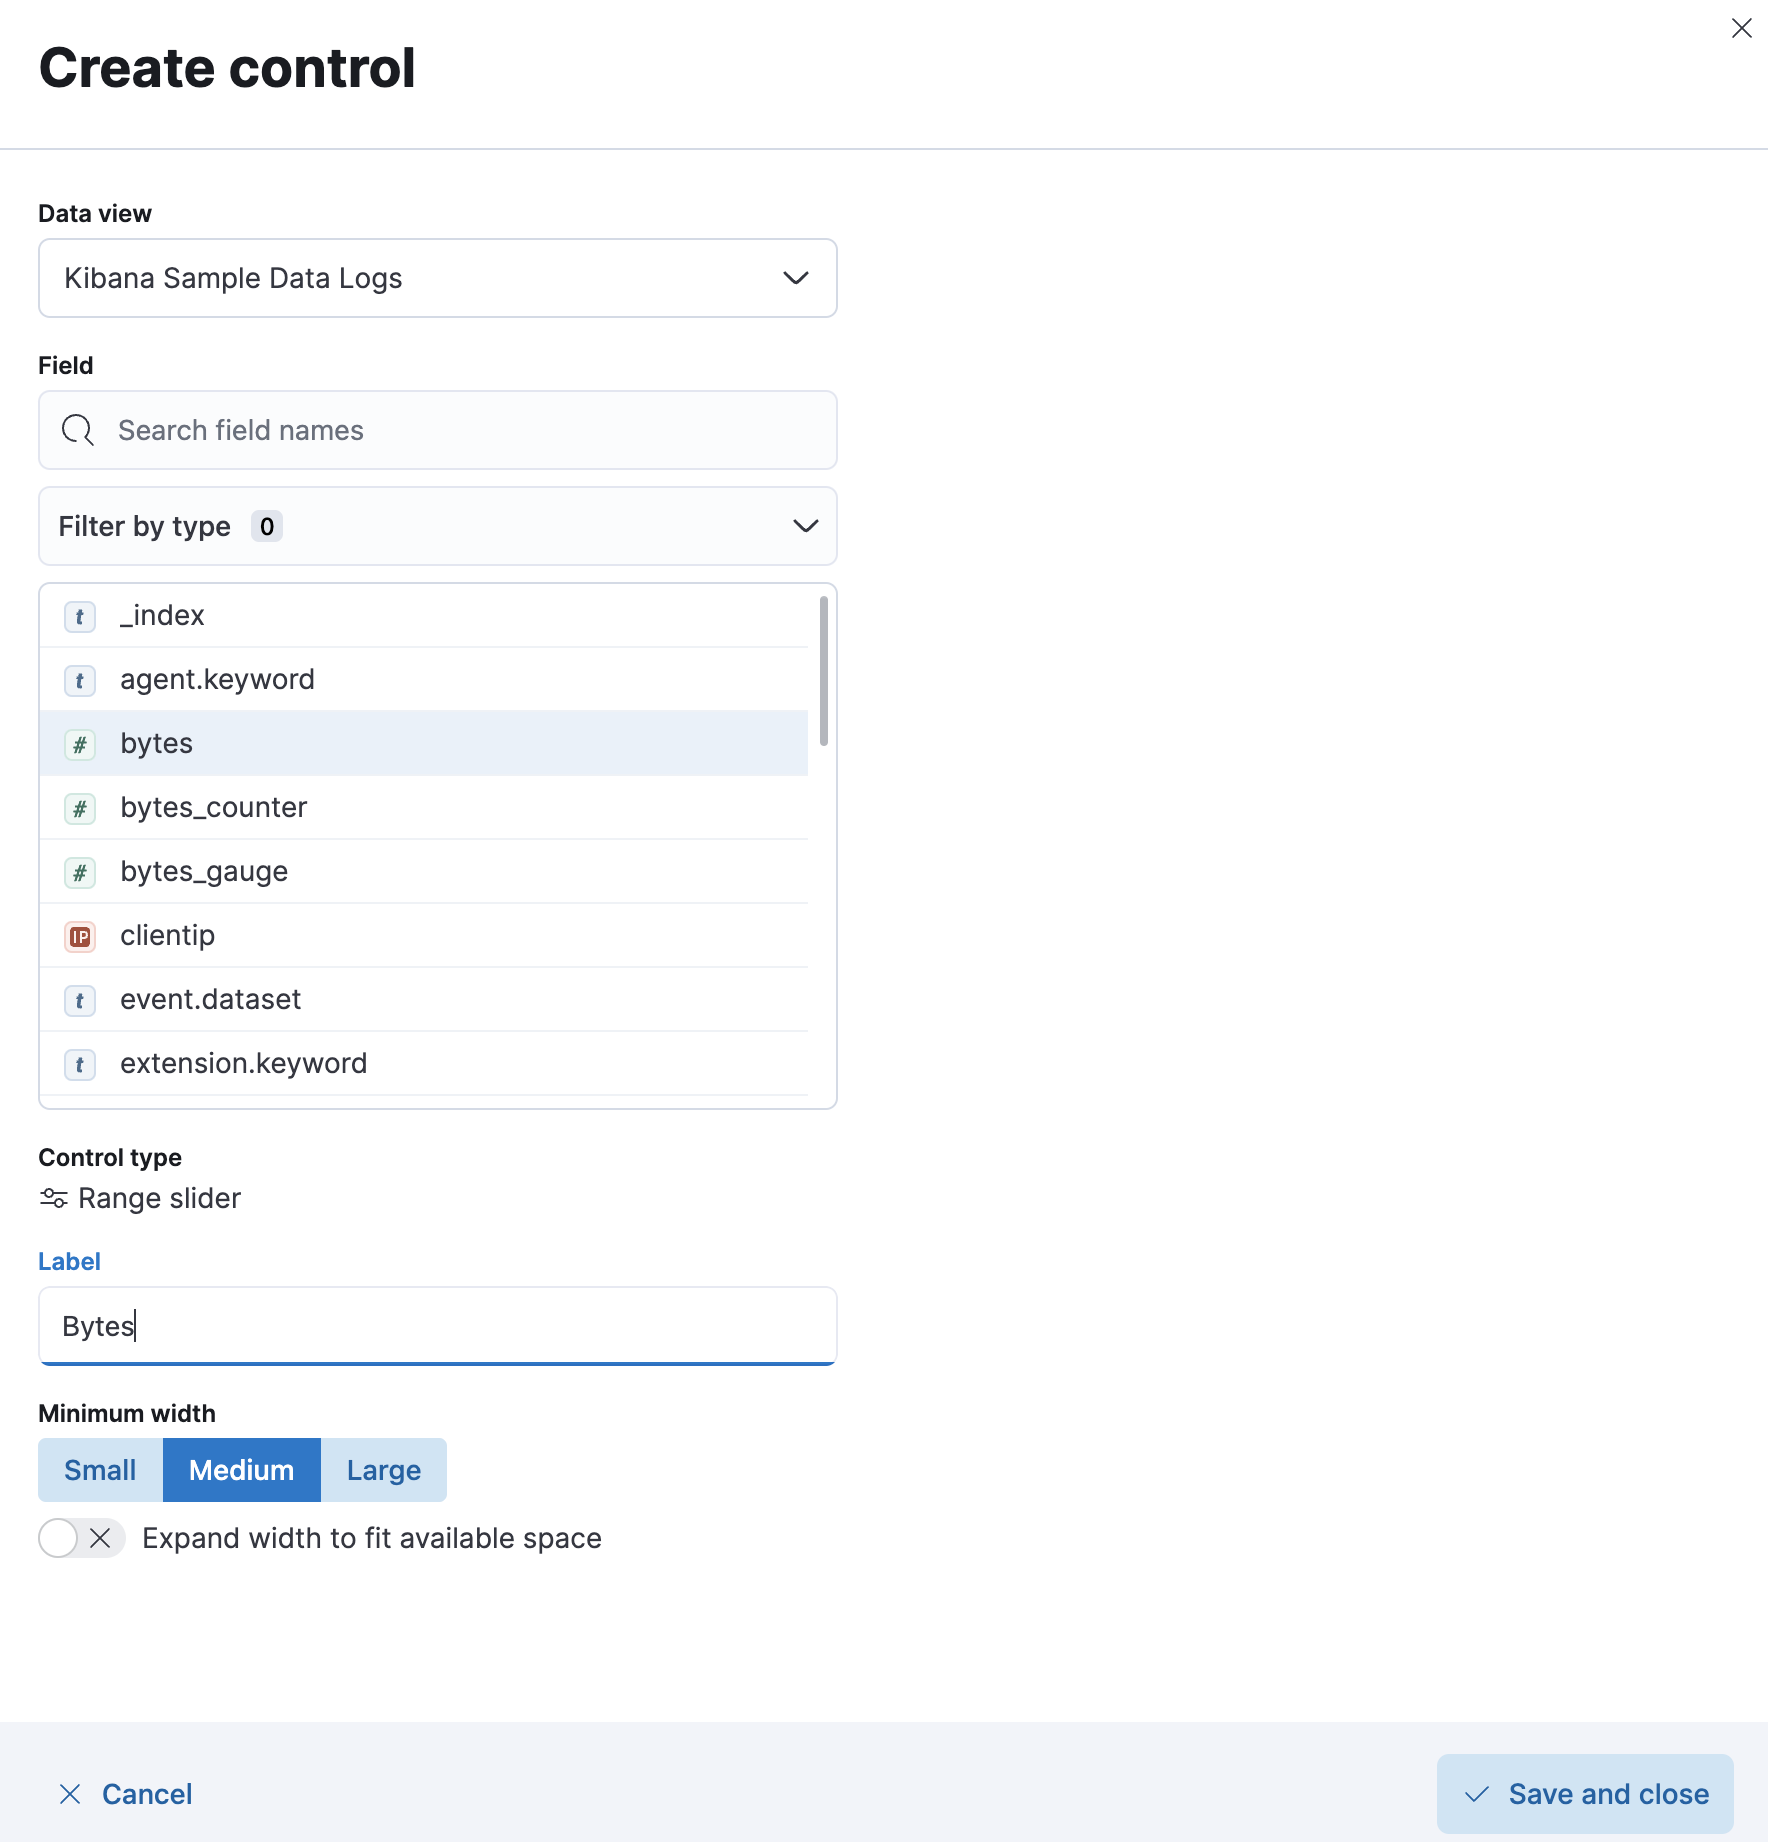
Now let's add a Range slider. Follow the same steps as done previously but this time use the field bytes and set the label to Bytes, once done click Save and close to create a new control.
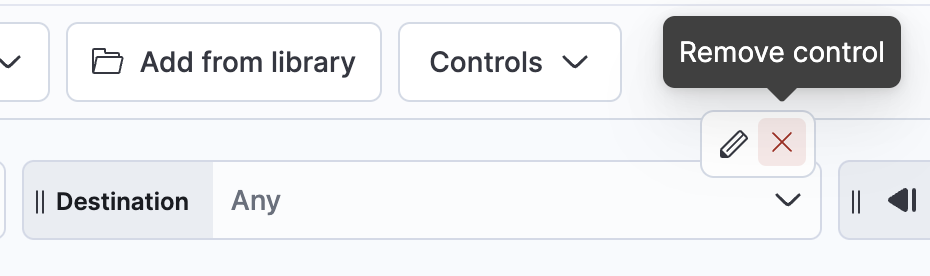
Note: If you already have a Bytes Control on the dashboard, click the red X to Remove control before completing this step
-
Choose to Clear selections from the first control (for Destination), and move the new Bytes control to the left side of it.
- Click the dropdown for the Destination control and Click the Clear selections icon to remove the filter.
- Hover over the far left side of the new Bytes control and drag it to the left of the Destination control.
-
Update the range on the Bytes slider to set a minimum of 15000 bytes. Open the Destination control and search again for fr. You'll notice that you don't find any results for this country anymore. This is because the Chain control option is enabled by default. You can disable it if you don't like this behavior.

-
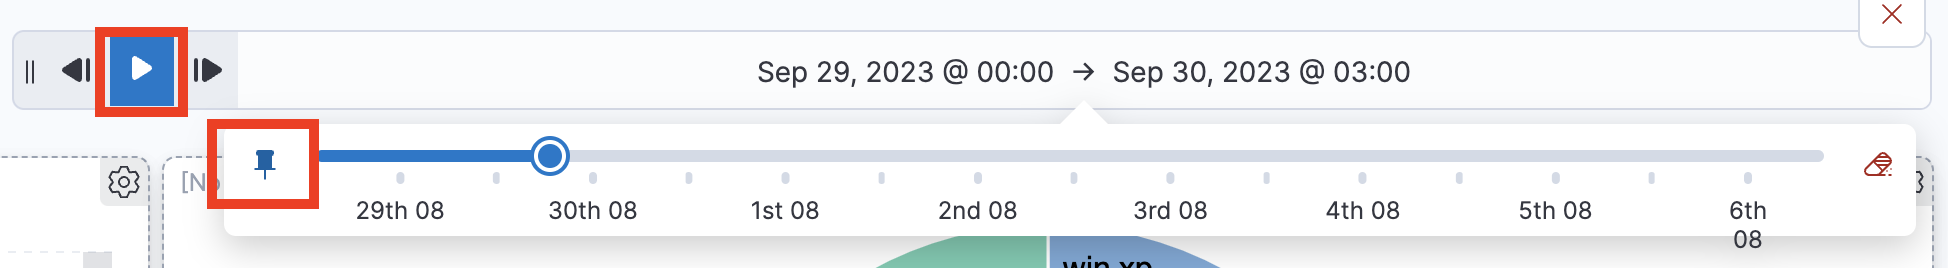
Choose to Clear range from the Bytes control, and then proceed to add a Time slider control. To do this, click the Controls dropdown again, but this time choose Add time slider control. Click on the Time slider to pin the start, and then click the play button to see the evolution of your data during the last week.
-
Click Save to make sure your controls are maintained in the dashboard.
-
You can edit any time your controls by hovering your mouse over it and clicking on the Edit control icon. Similarly, you can remove it as well from the Dashboard.
-
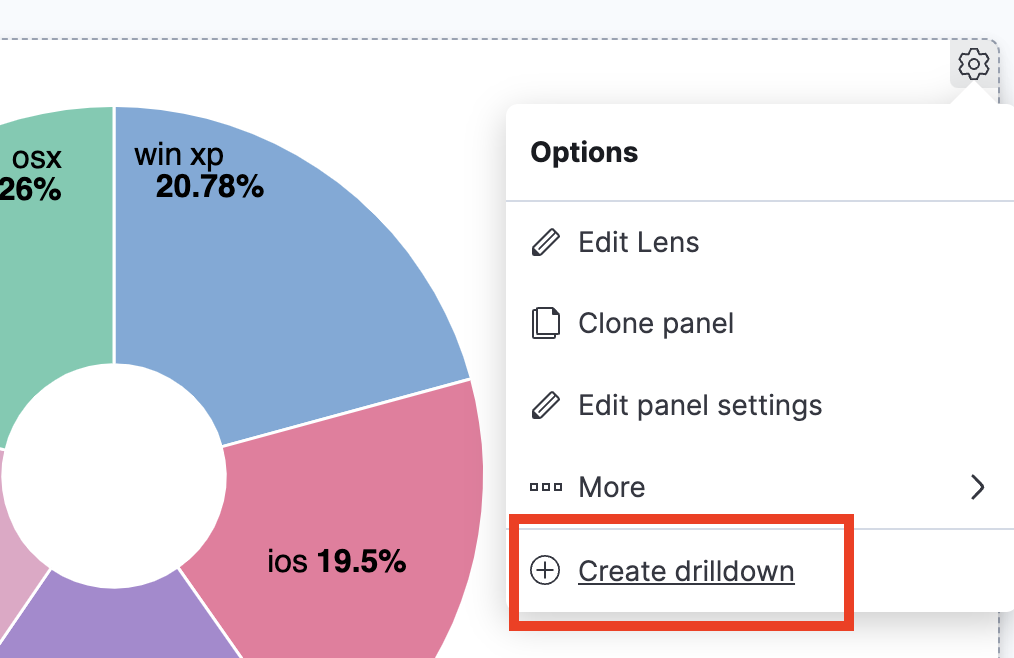
Let's create a drilldown. Go to the donut chart we created in Lab 1.2 of the machine.os field. Create a drilldown that will perform a Google search on the machine OS selected on this donut chart.
Show answer
Click on the panel options and select Create drilldown.
Select Go to URL.
For the Name enterGoogle search.
Select the Single click trigger.
The Enter URL value should find the event.value on Google.
Set the Enter URL value to:https://www.google.com/search?q={{event.value}}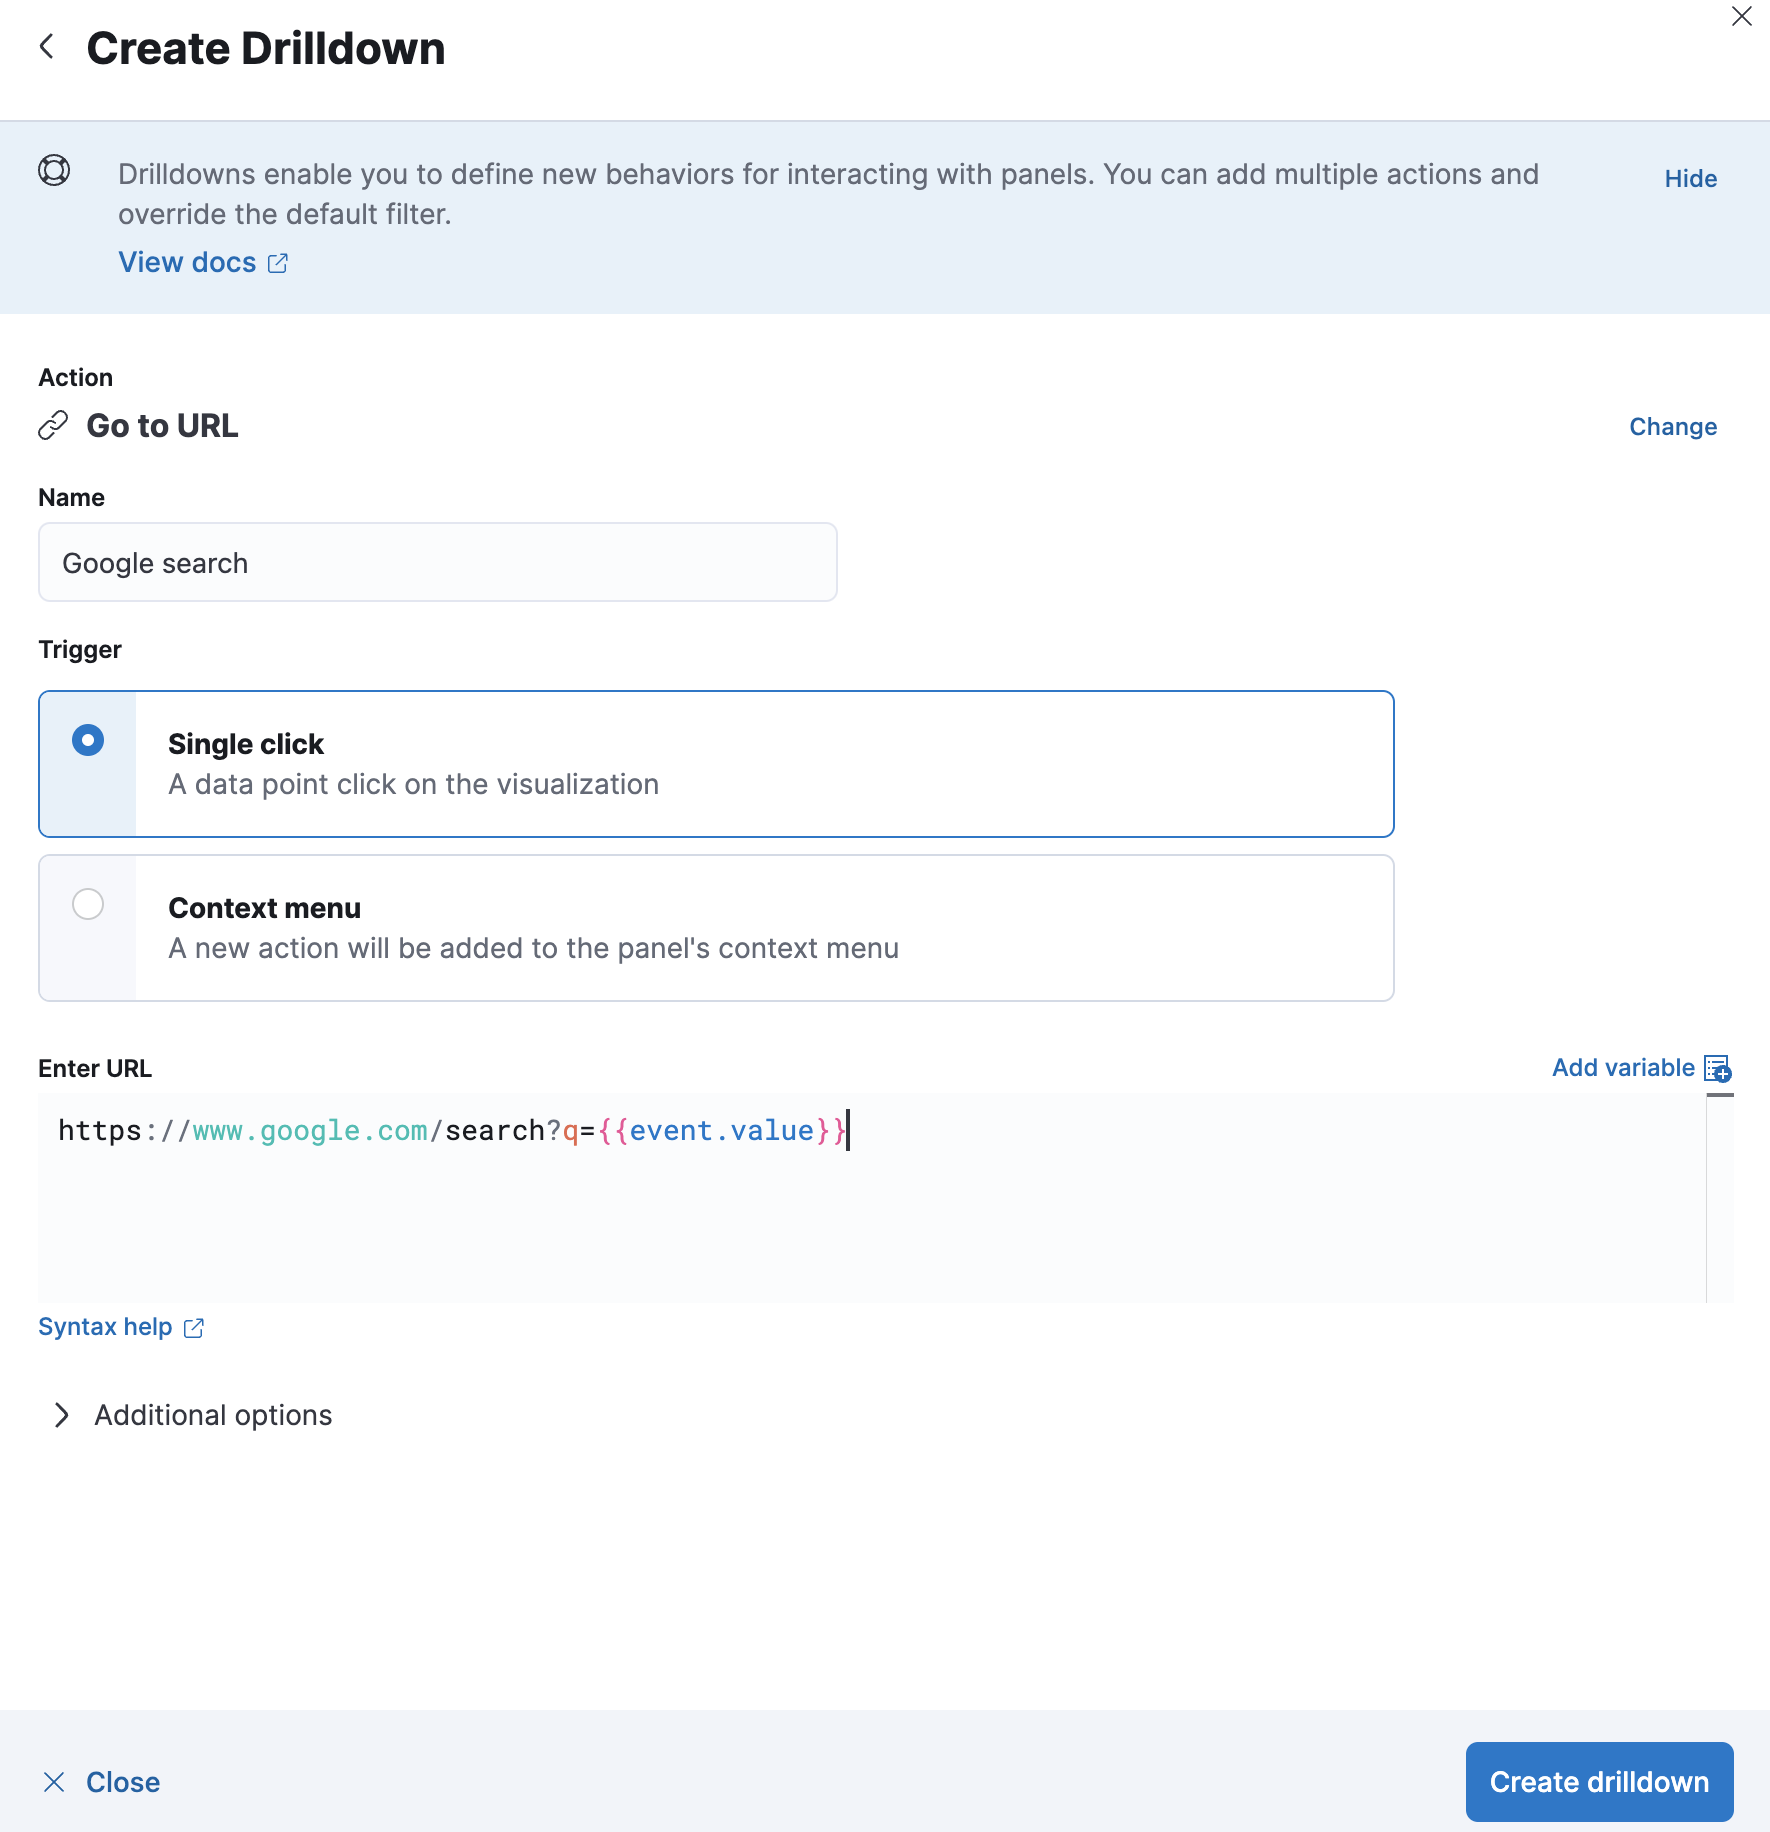
Click on Create drilldown and test it to make sure it works.
-
Clear any of your control filters before moving on to the next lab.
Summary:
In this lab, you created multiple controls and saw how they interact with each other. You also defined a drilldown for the pie chart visualization.