6.1: Intro to Elastic ML
Objective:
In this lab, you will learn how to set up single-metric and multi-metric jobs.
-
In Kibana, open the Machine Learning interface by clicking on:
- > Analytics > Machine Learning
-
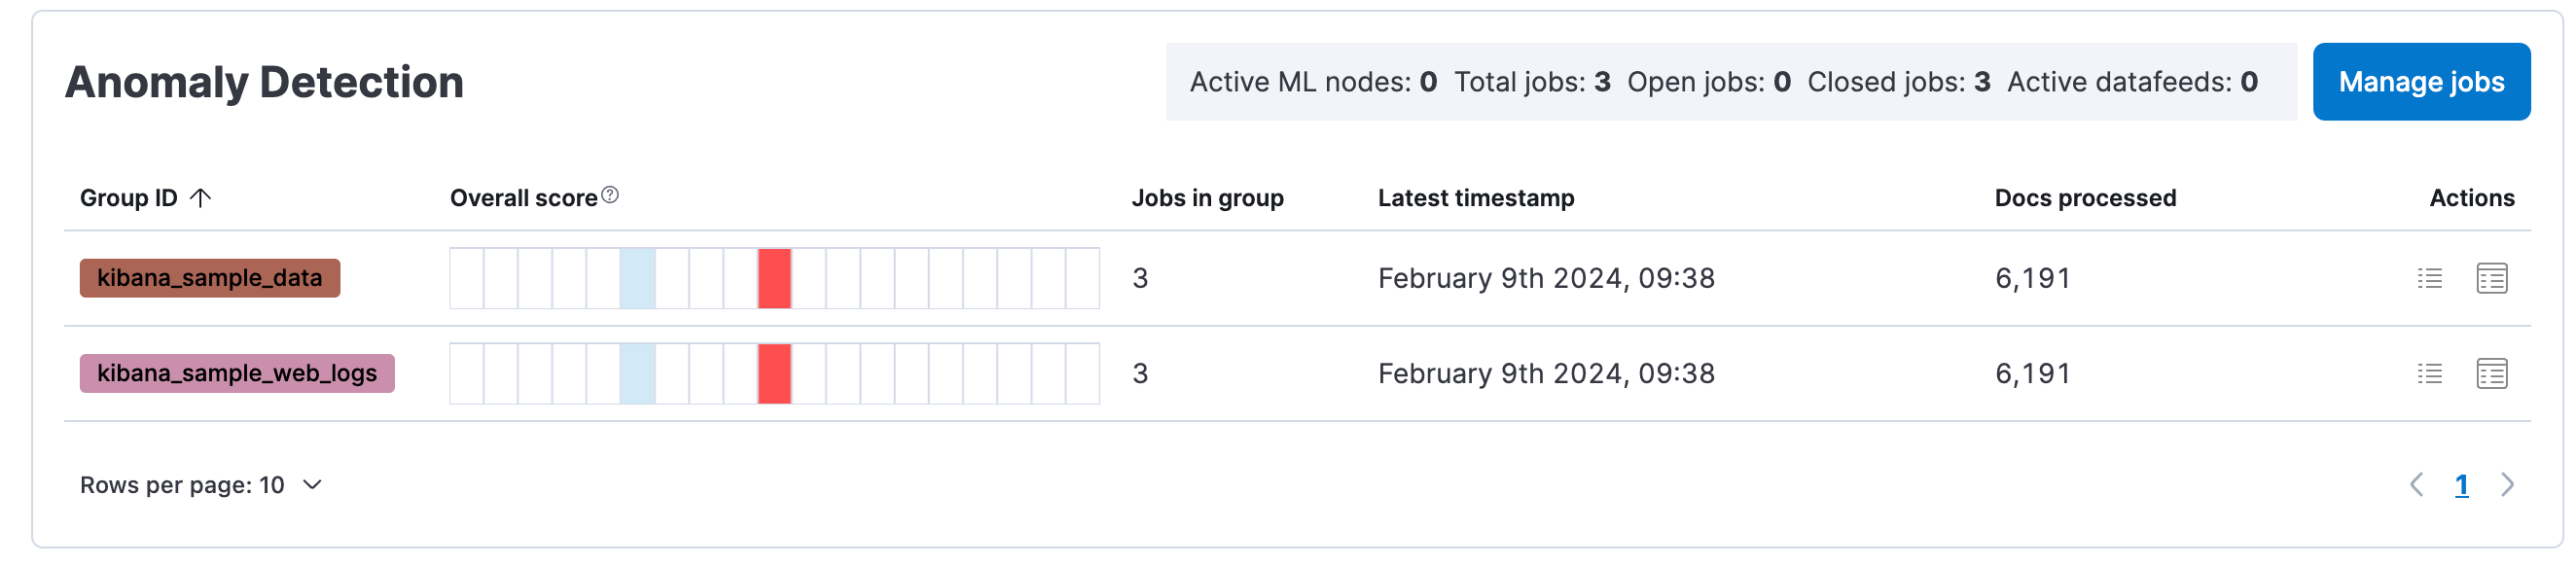
On the Overview page, you should see anomaly detection information that was created in the first lab.
-
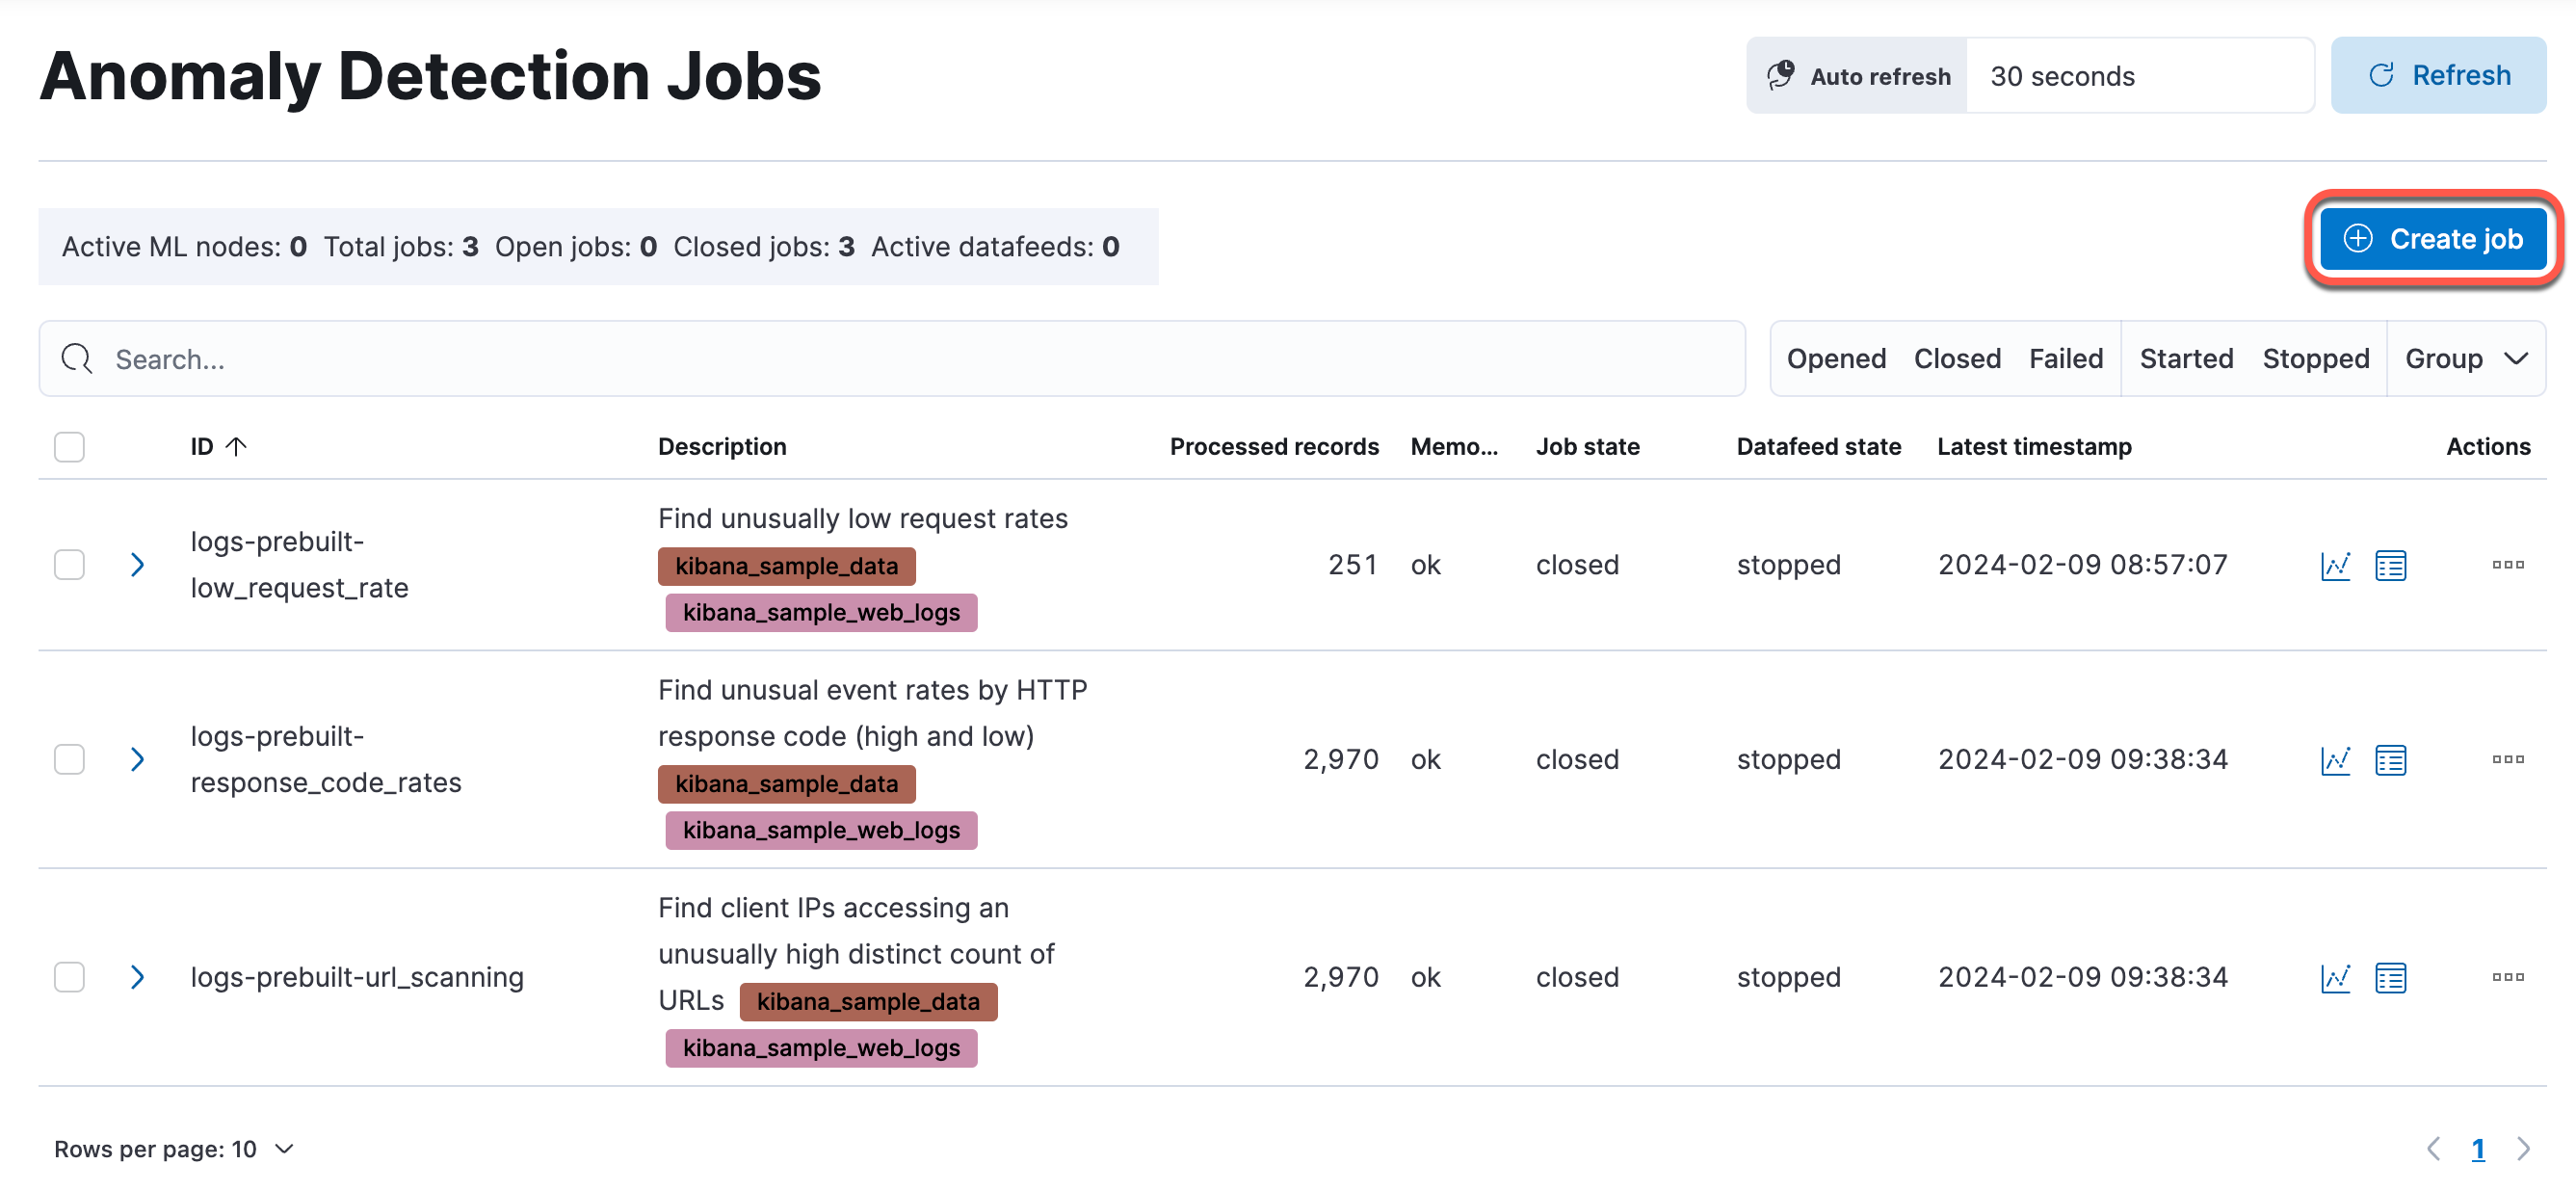
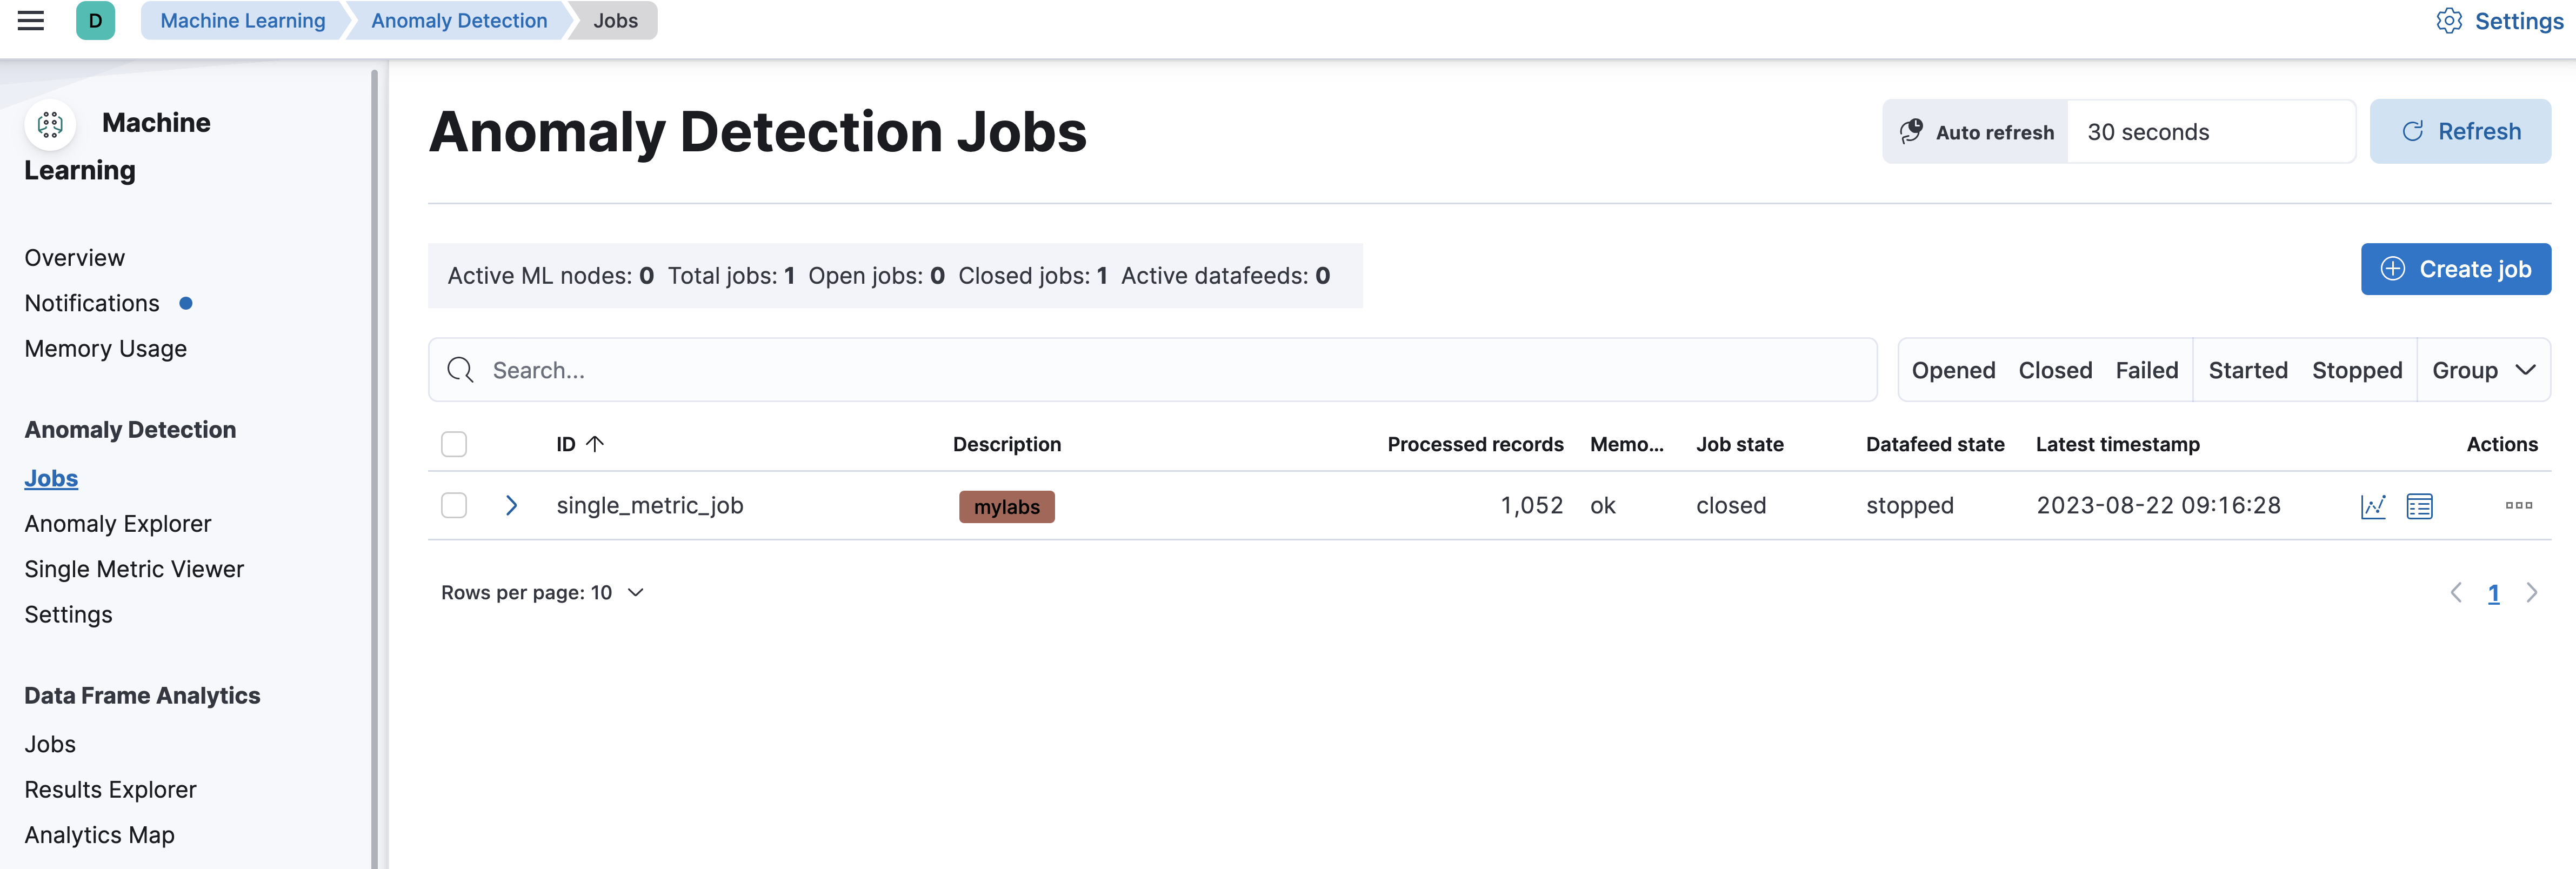
Click Manage jobs, which displays a list of all anomaly detection jobs. Next, click Create job to create a new anomaly detection job.
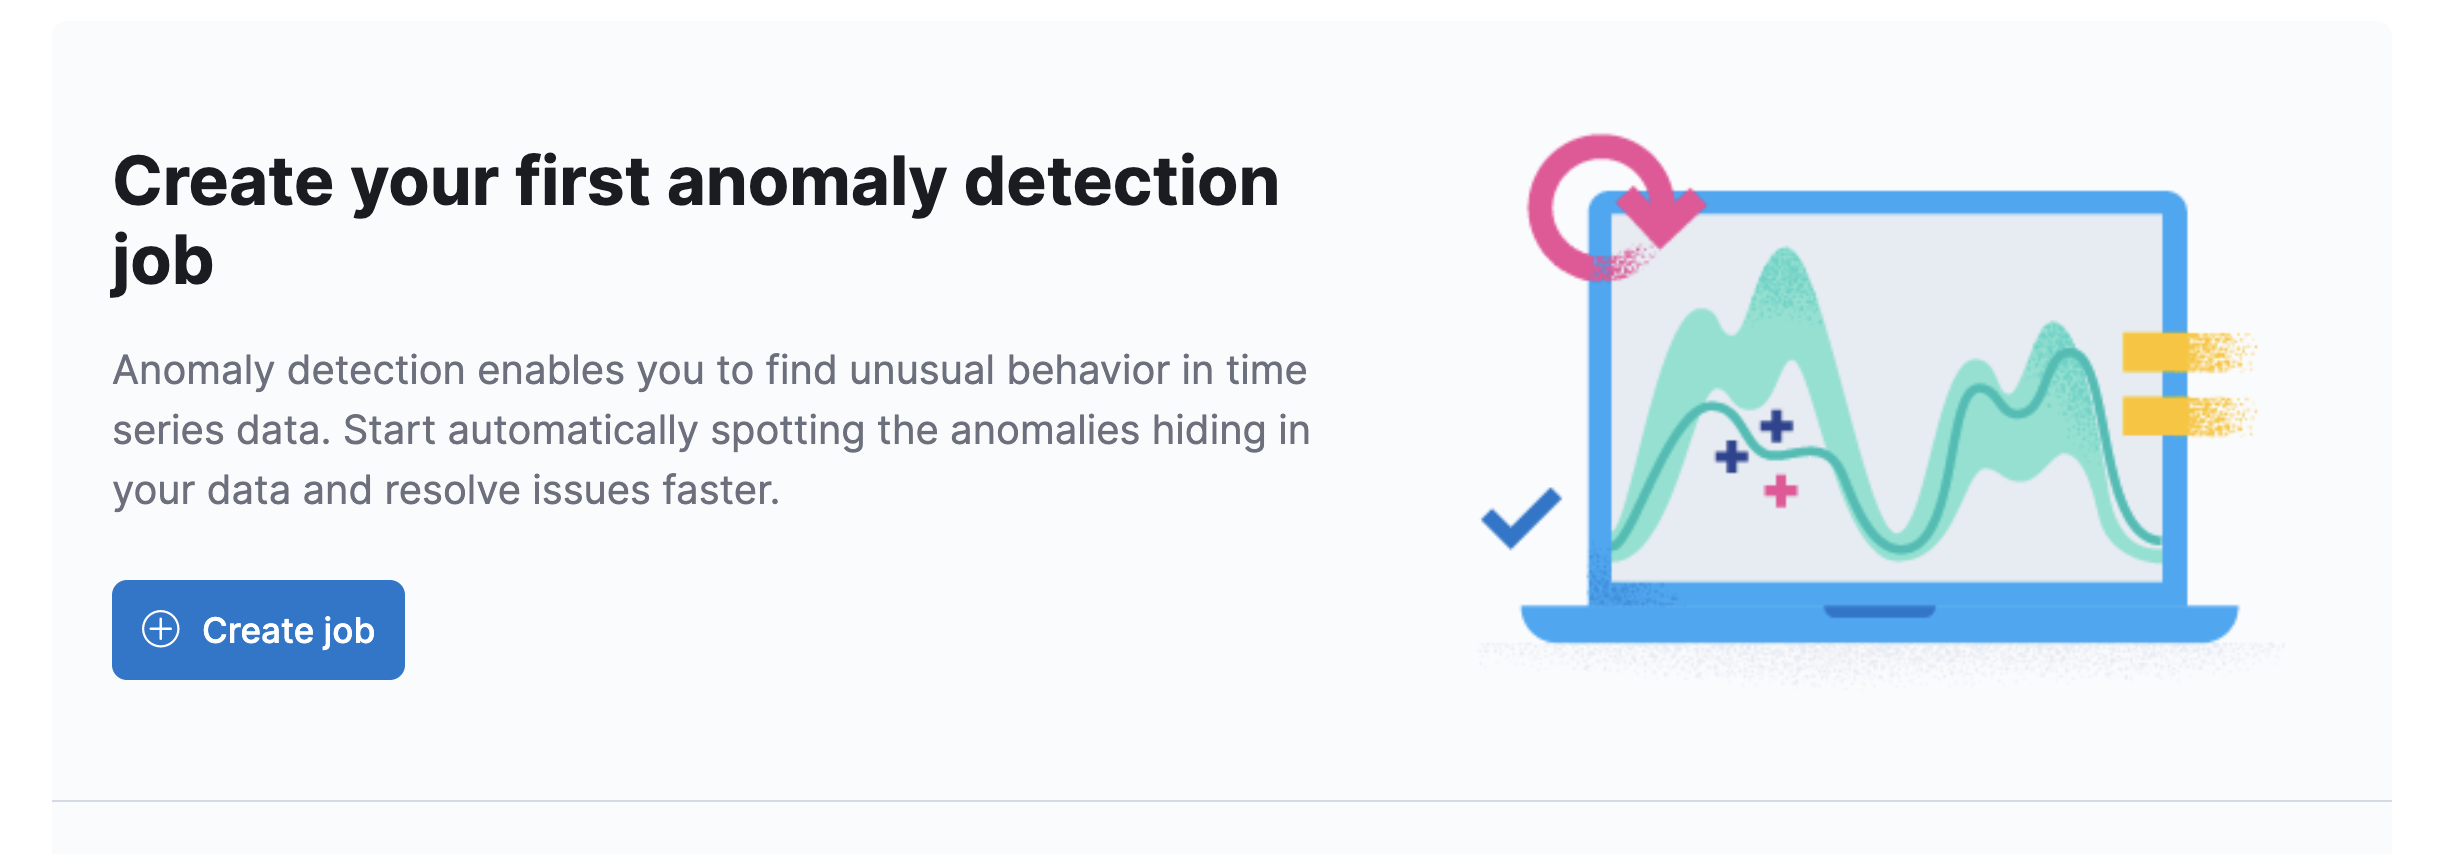
Note
If you did not create a machine learning job in the first lab, you will see the following image. Click Create job to create a new anomaly detection job.
-
Select the Kibana Sample Data Logs data view.
-
Select the Single metric wizard.
-
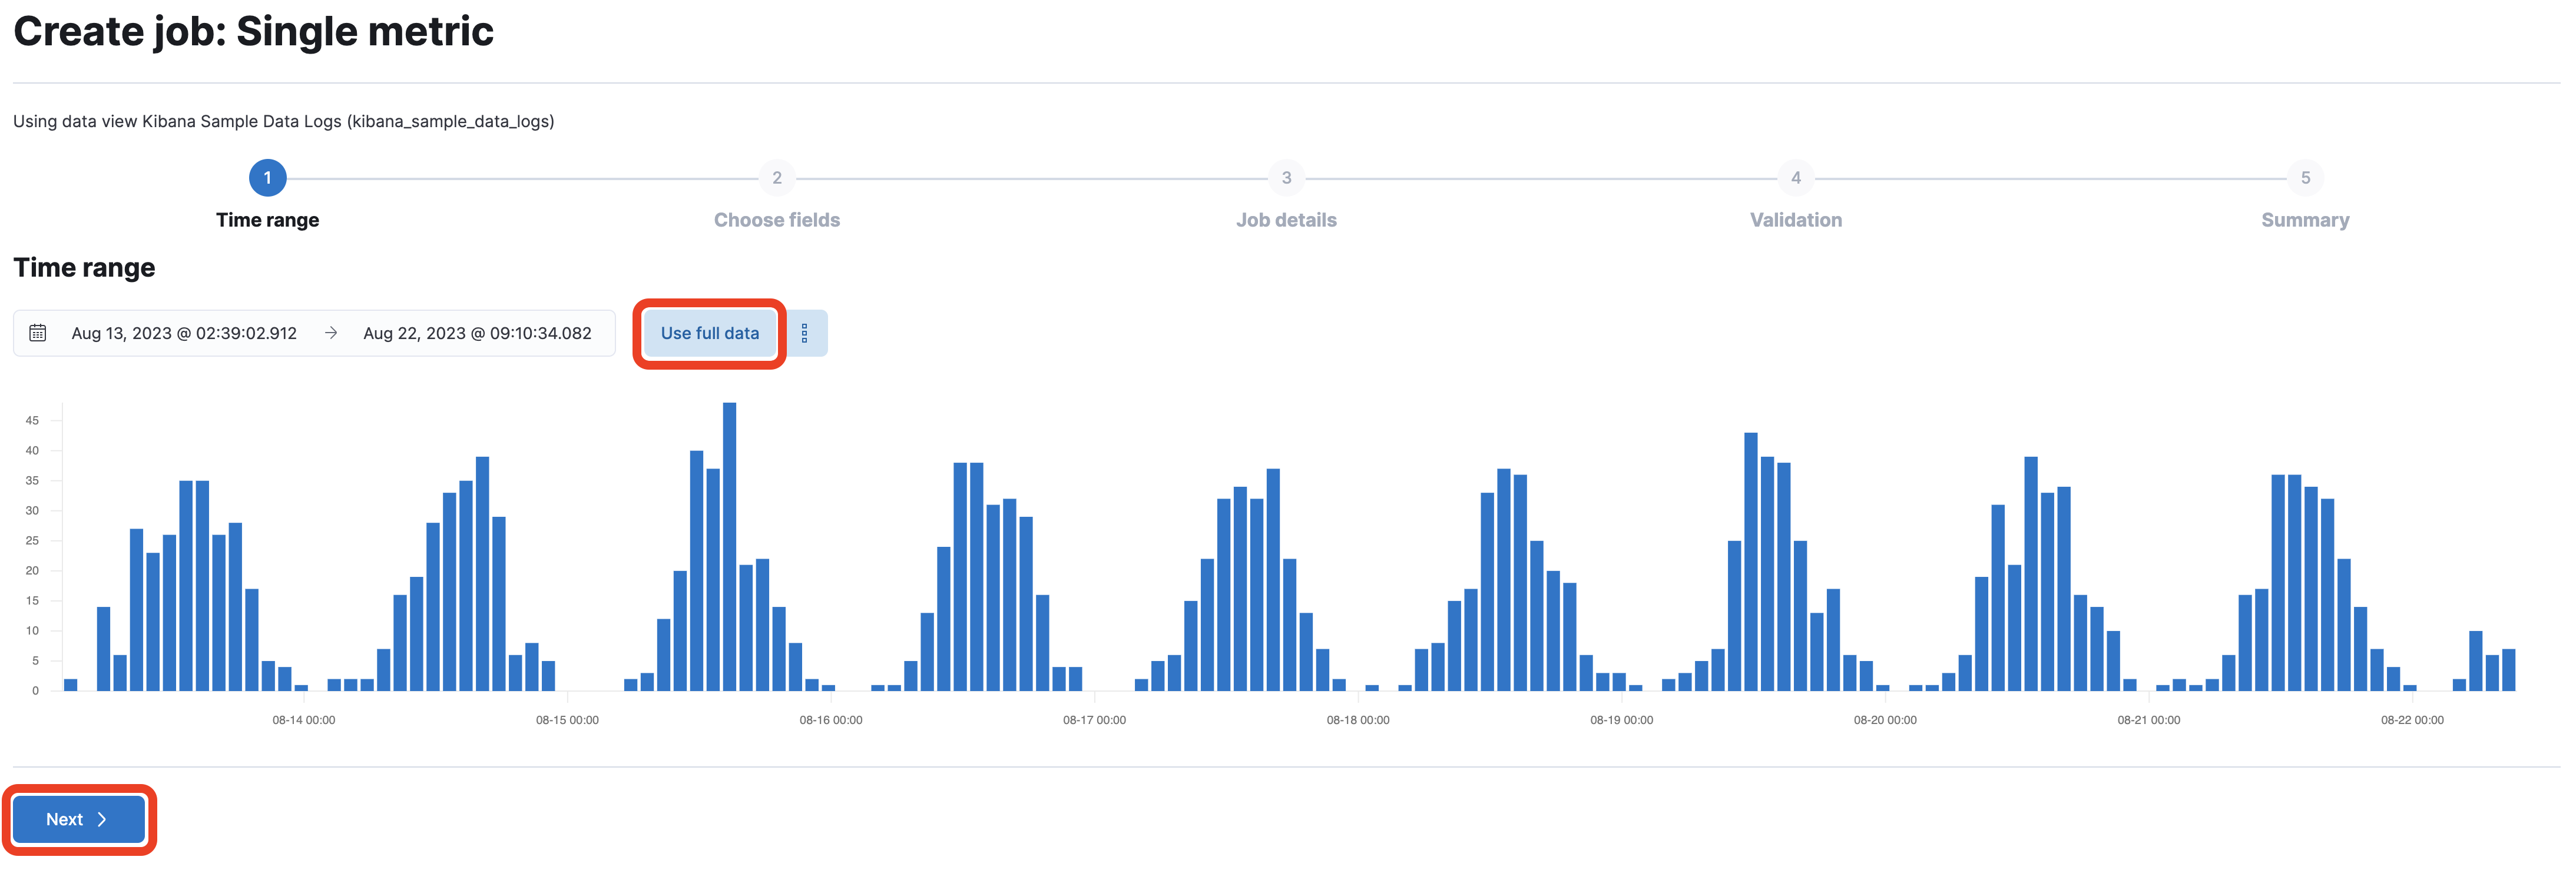
Set the time range to cover the entire dataset by clicking on Use full data, then click Next.
-
Choose the function High sum on the Bytes.
-
Enter
1hfor the bucket span and click Next.
-
Enter
single_metric_jobas the Job ID, and create a new group calledmylabs, then click Next.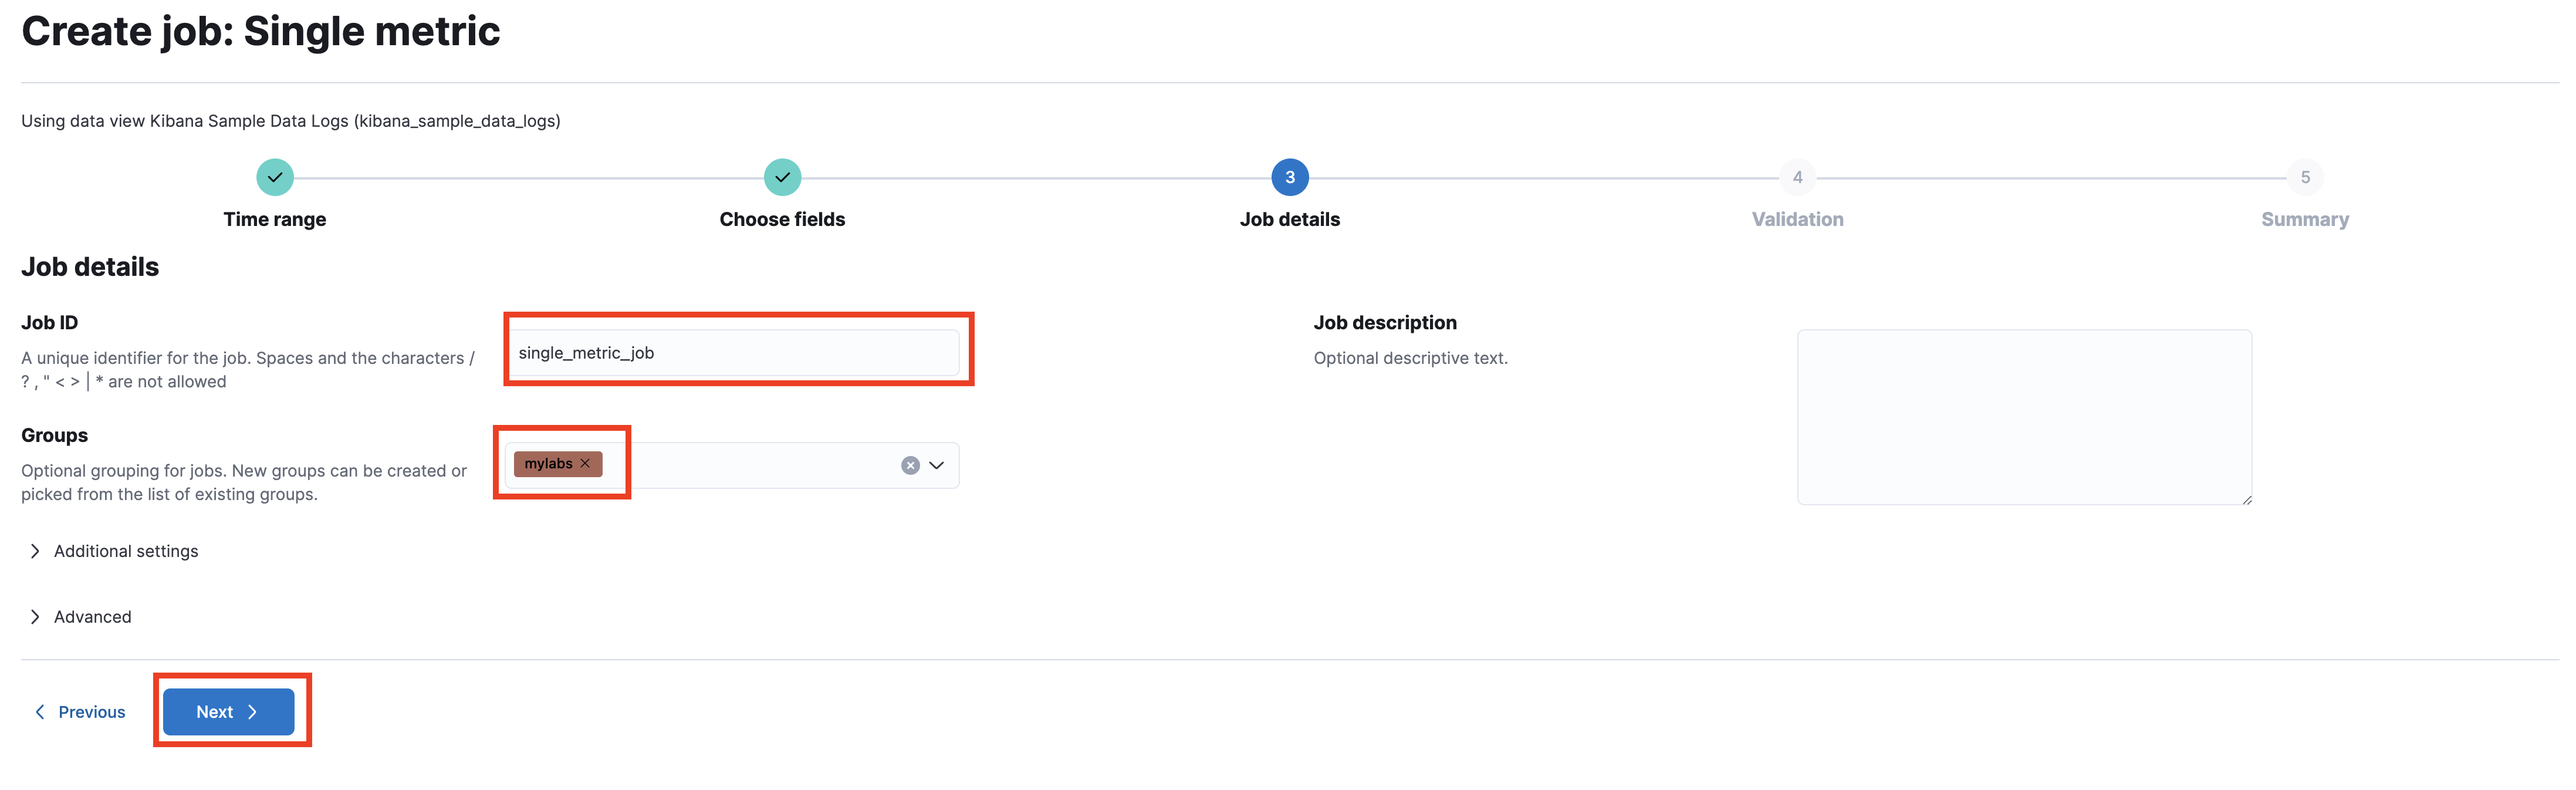
-
The data validation step should pass without problems. Click Next to proceed.
-
Review the job configuration, and click Create job to start the job.
-
The job should take a few seconds to complete. Once done, click View results to analyze the results.
-
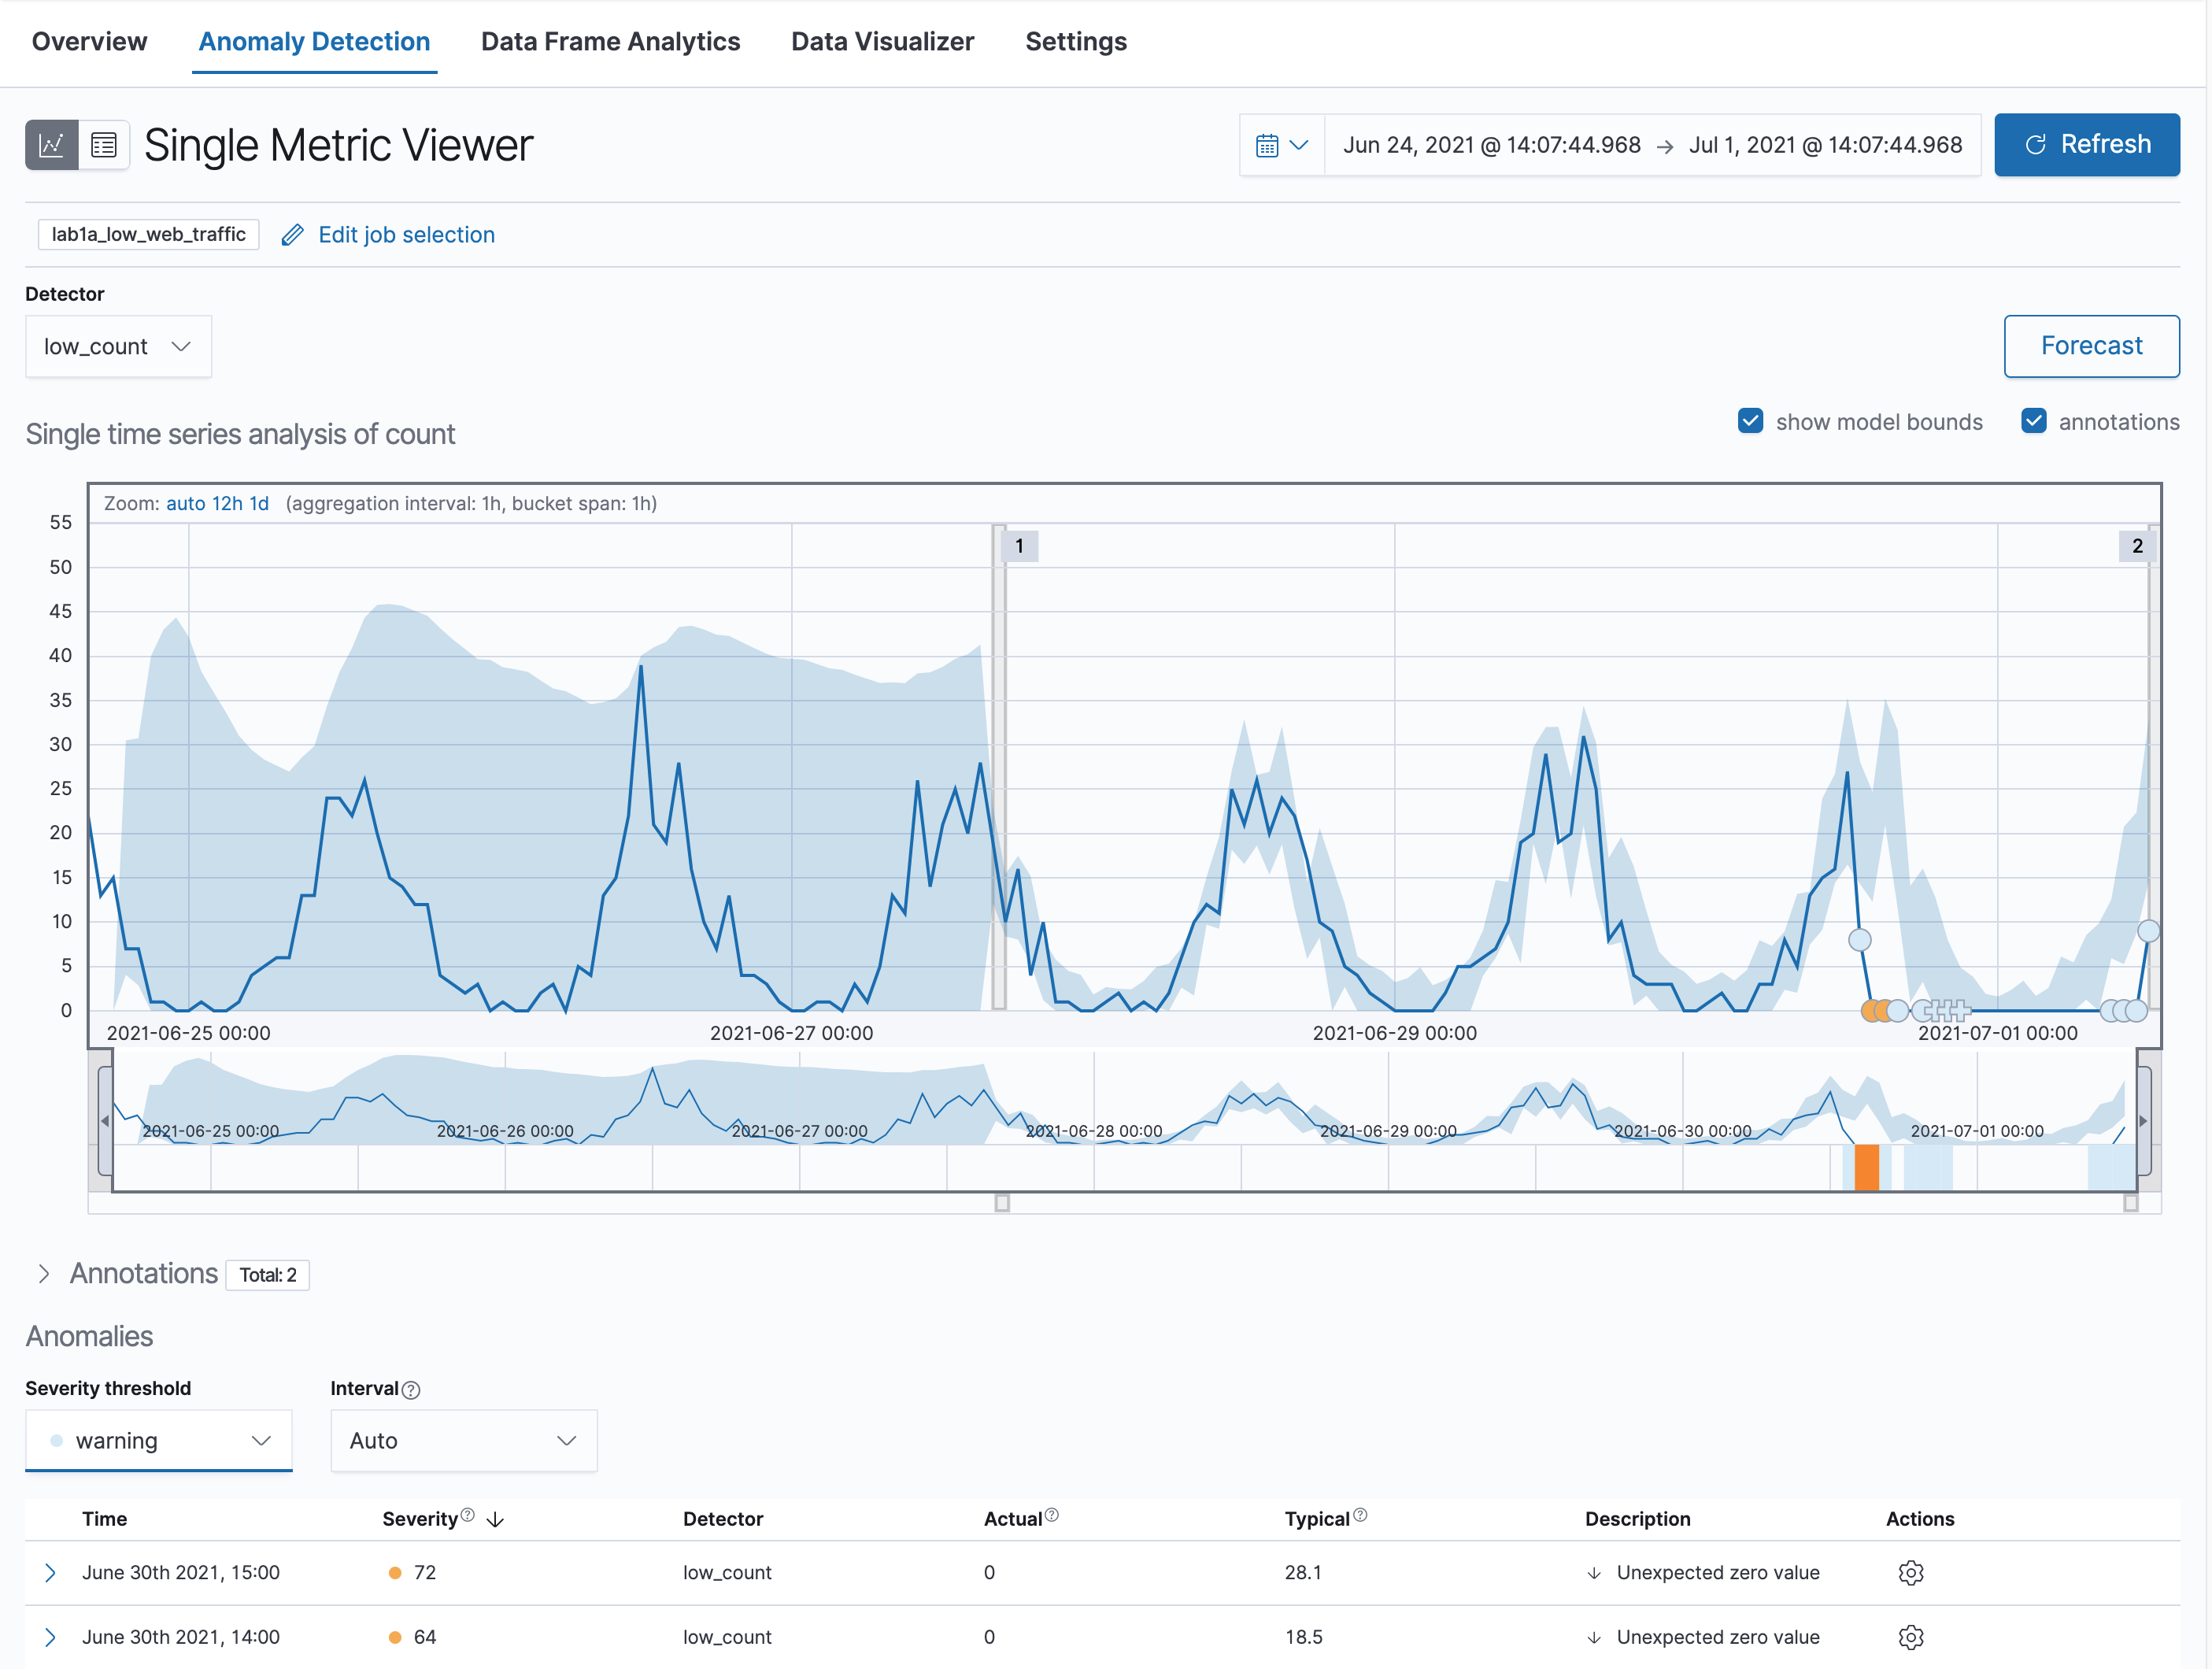
In the Single Metric Viewer: Drag the slider below the chart to the beginning of the time period, if necessary. The blue line in the chart represents the actual values in your data. The shaded blue area represents the expected range of the values according to the model. This range becomes more accurate as the model improves by processing more data.
-
Next, if necessary, expand the timeline to analyze the full data. Critical anomalies are shown in red. Lower-scored values are indicated in orange, yellow, or blue.
-
Notice that the model has identified a minor anomaly (in yellow). Zoom in on this area to inspect this anomaly.
-
If you want to know more details about this anomaly, hover your mouse over it. This anomaly was given a severity of 44 (the exact number may vary).
-
The anomalies are also listed below the chart. In this table, you can see the actual count at this point in time and what the typical count should be, according to the model.
-
Next, you will create a multi-metric job, which can contain more than one detector. You can use influencers to understand if another field is to blame for the existence of the anomaly, or at least whether it had a significant contribution. On the left side menu, click on Jobs under Anomaly Detection and then click Create job.
-
Select the Kibana Sample Data Logs data view.
-
This time, create a Multi-metric job.
-
Set the time range to cover the entire dataset by clicking on Use full data, then click Next.
-
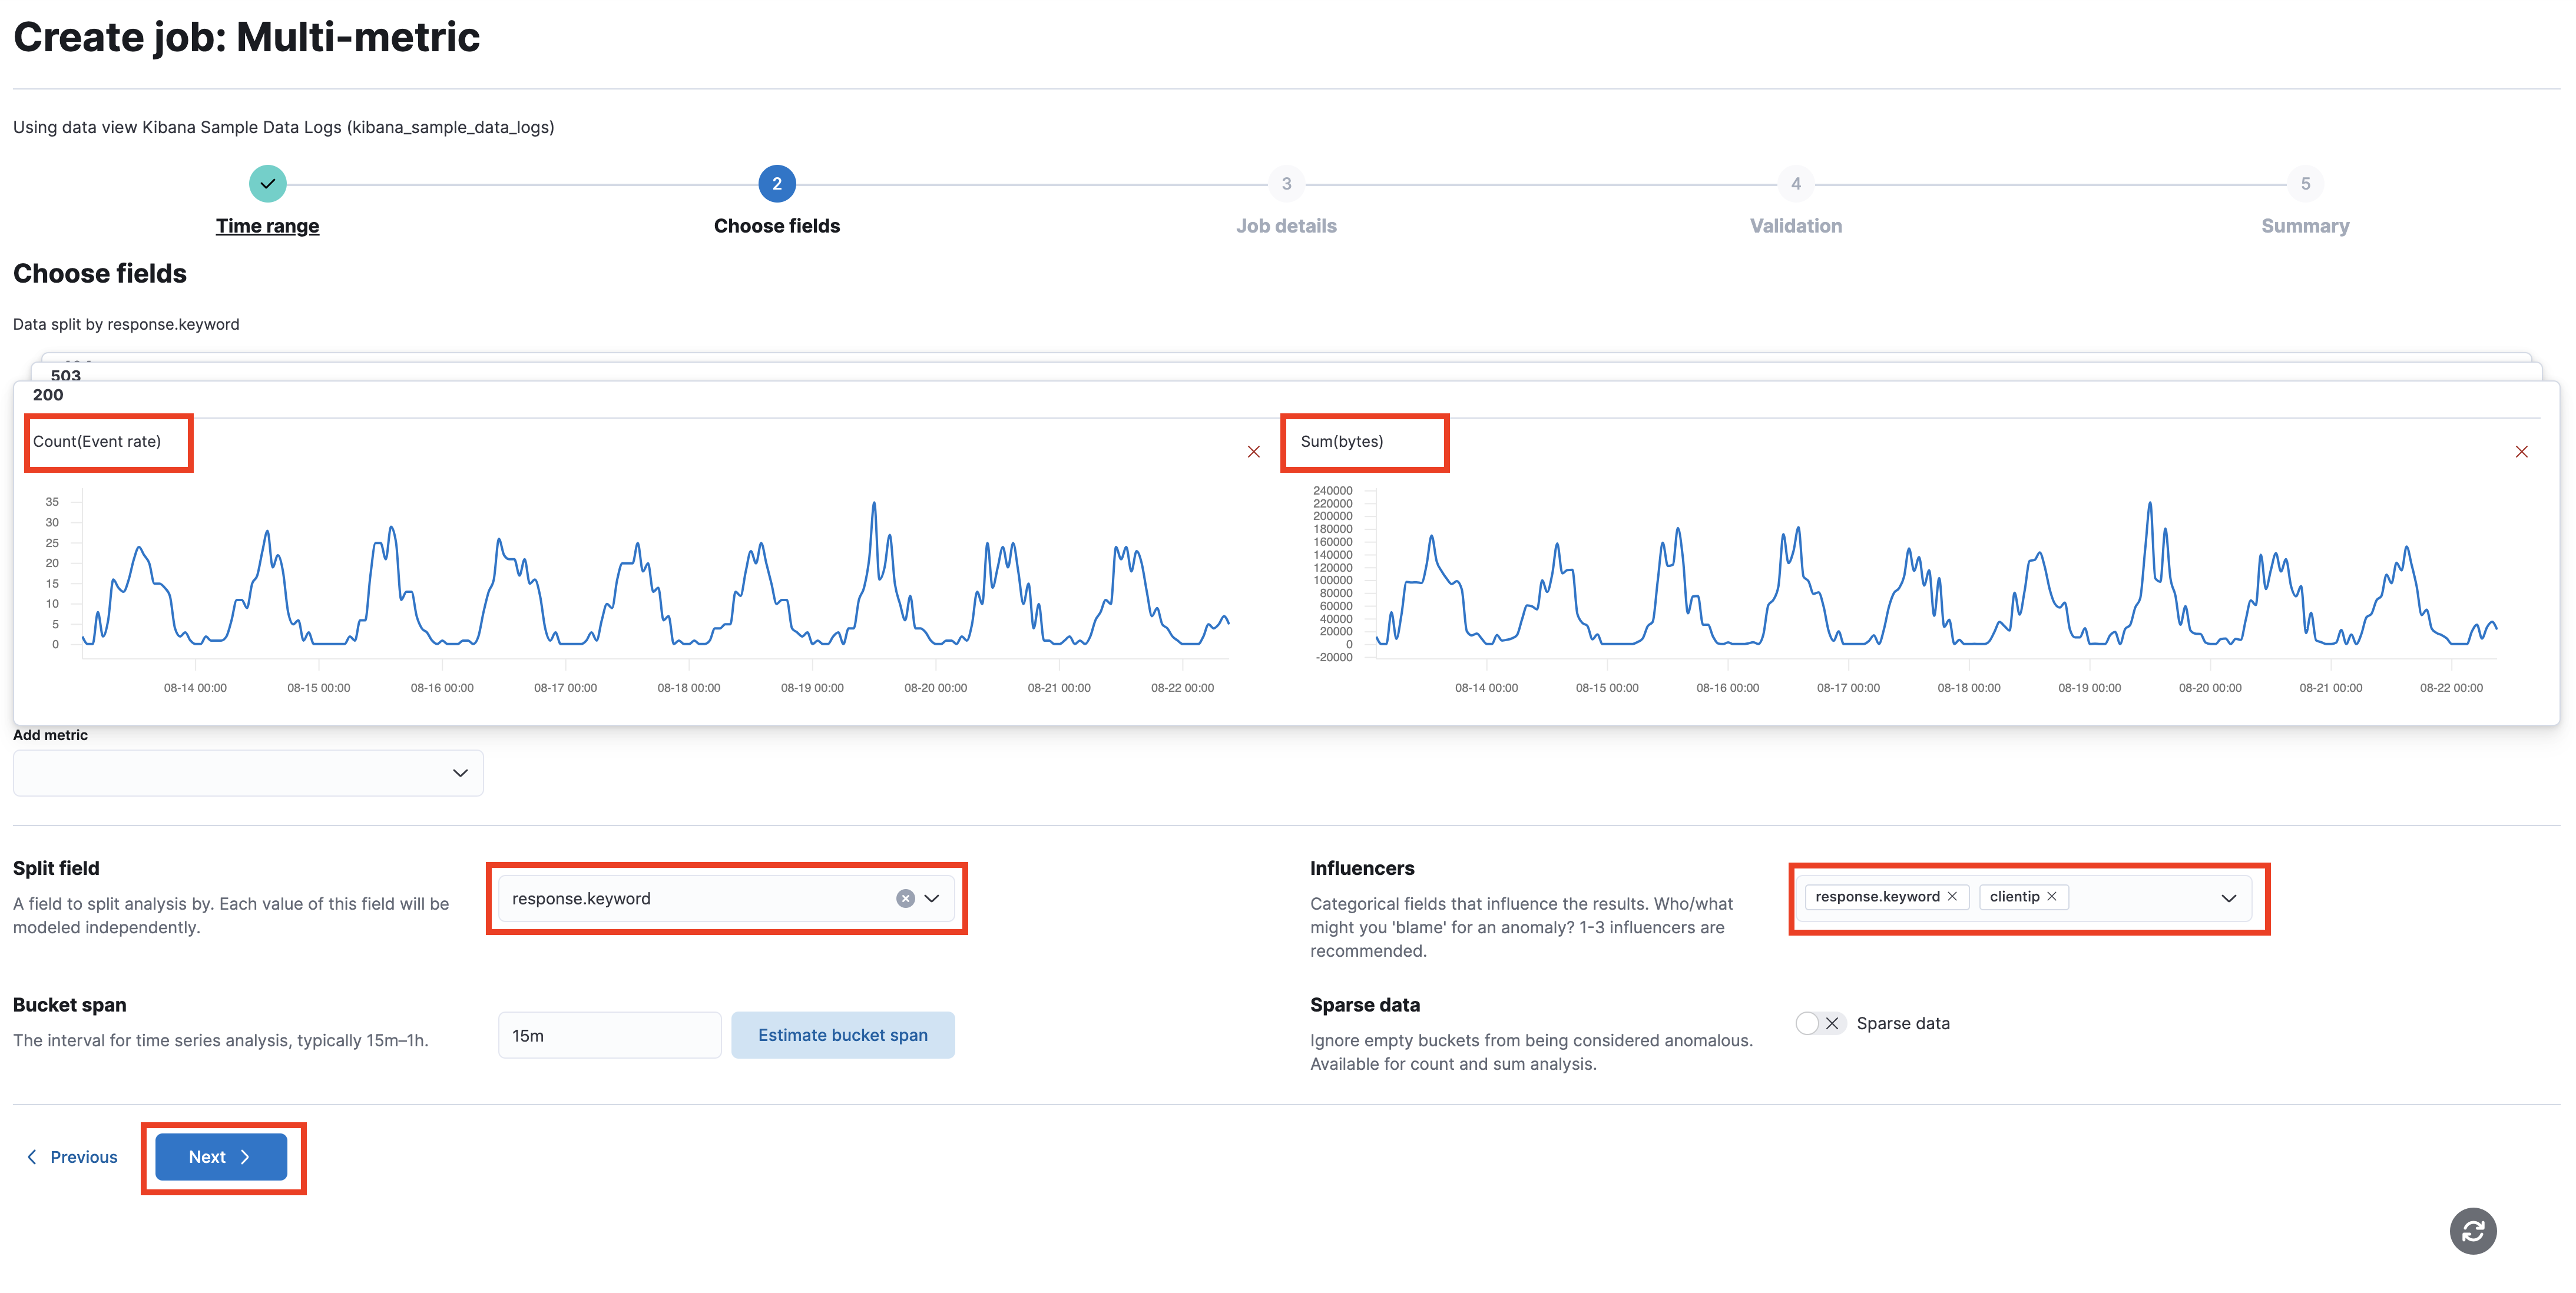
Set up the job with the following settings:
- Choose the metric: count on the event rate.
- Add another metric: a sum of bytes.
- Split the data on response.keyword (the HTTP status code).
- Add clientip as an additional influencer.
- Click Next.
-
Enter
multi_metric_jobas the Job ID, and add this job to themylabsgroup. Click Next. -
The job should pass through the validation. Click Next.
-
Review the job configuration, and click Create job to start the job.
-
After the job has been completed, click View results to review the results in the anomaly explorer.
-
At a glance, you can tell that there were critical anomalies associated with the
response.keyword200 over the past week. You'll see a critical anomaly for the sum of bytes as well as one for the count. You can also see what IPs the anomalies seem to be caused (influenced) by.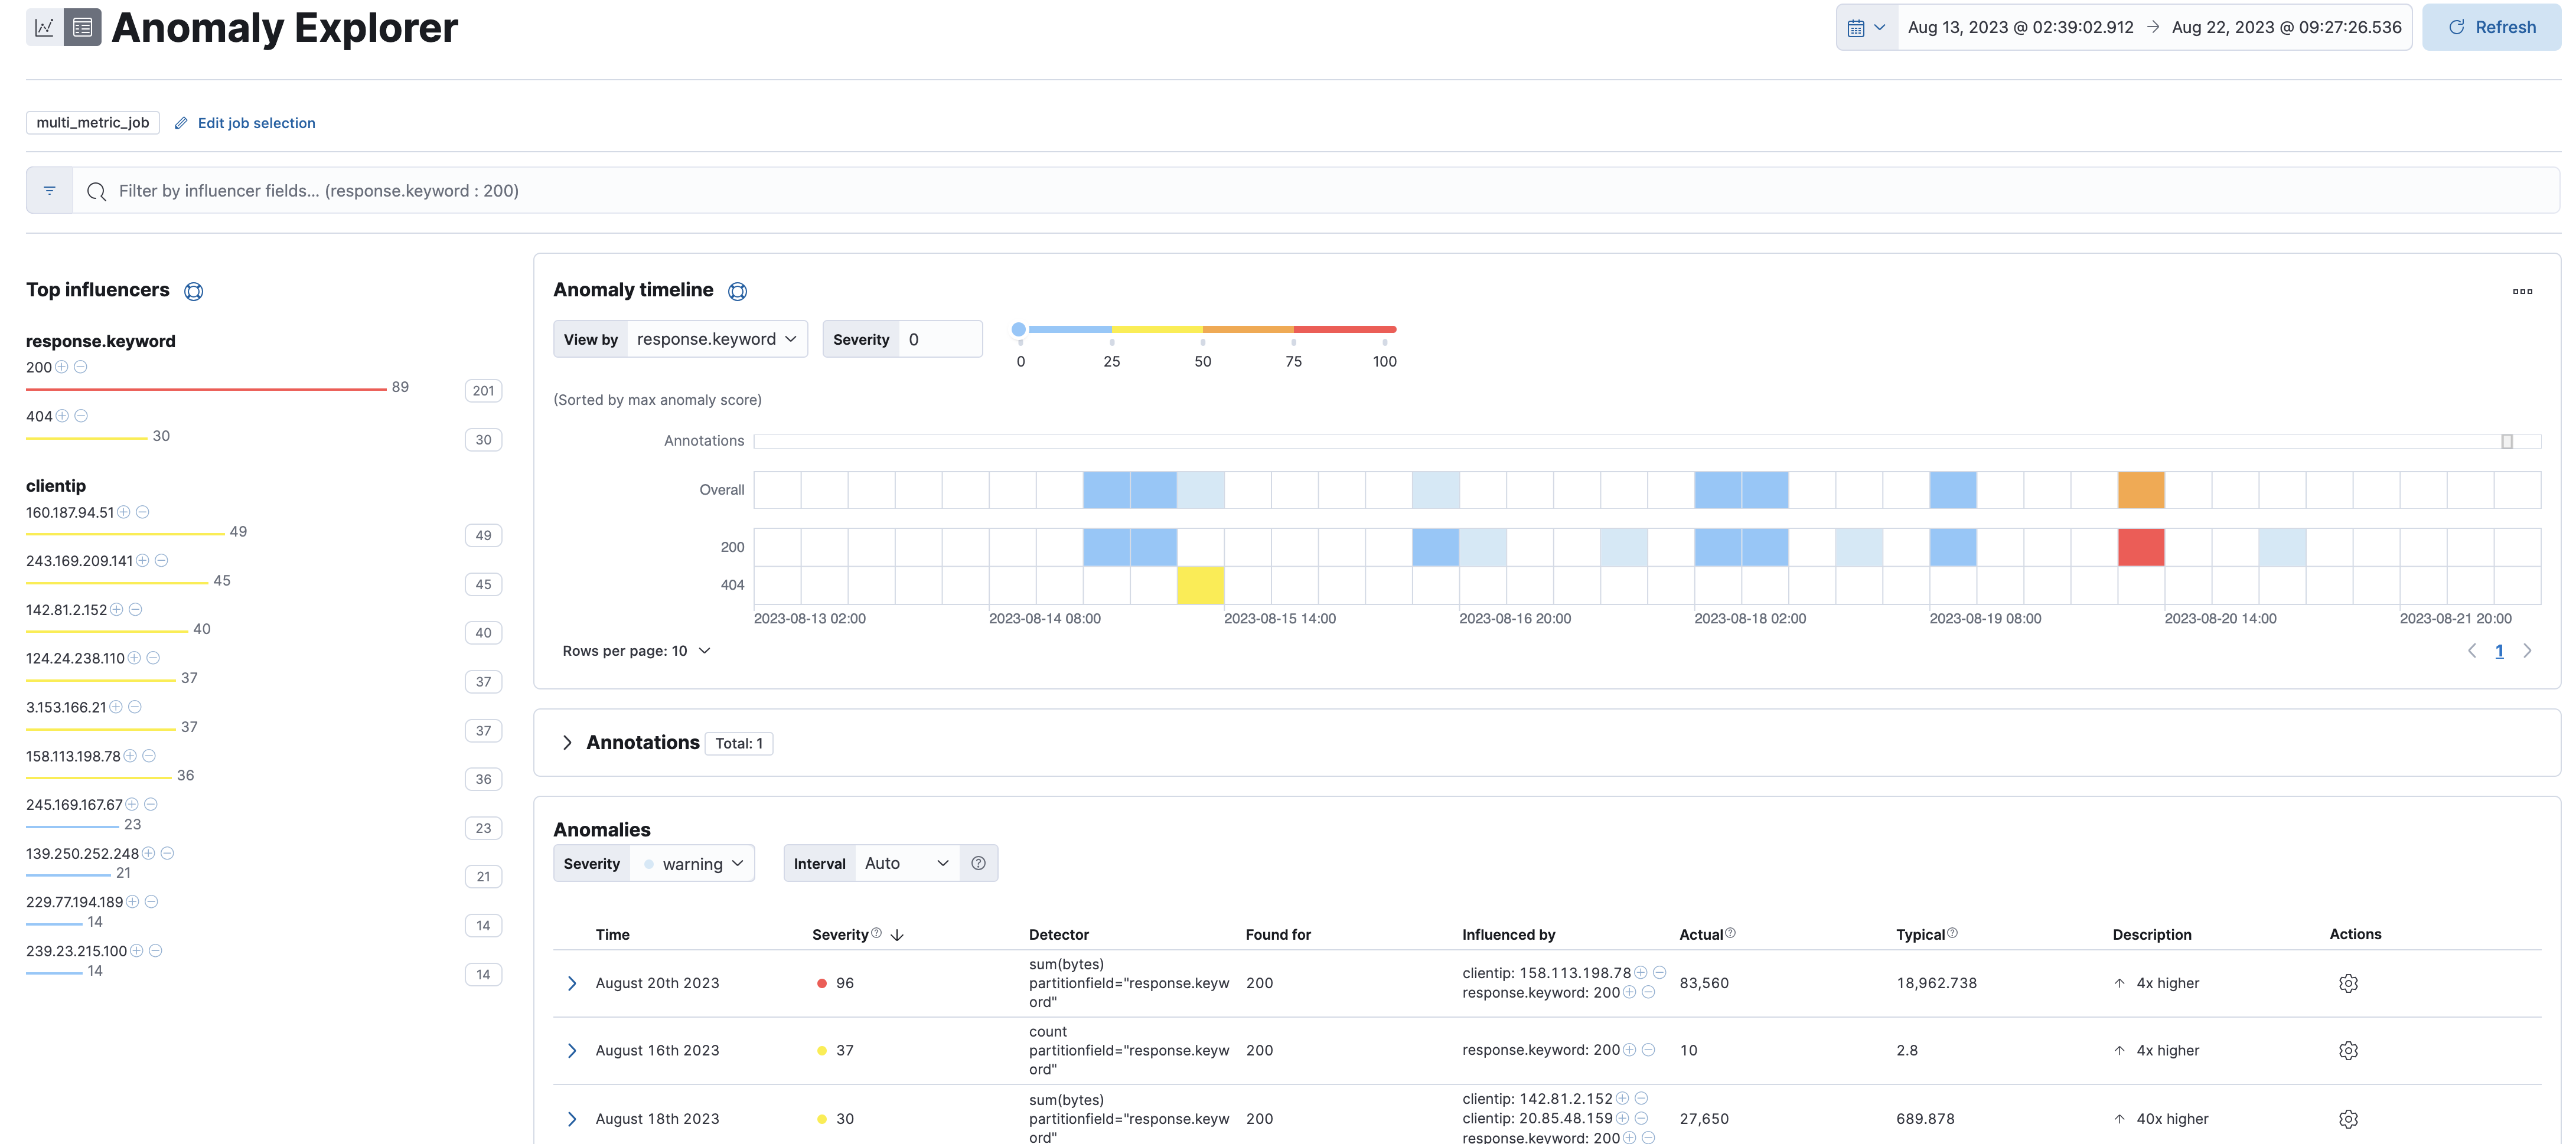
-
Click on the red square for
response.keyword200 to drill down further: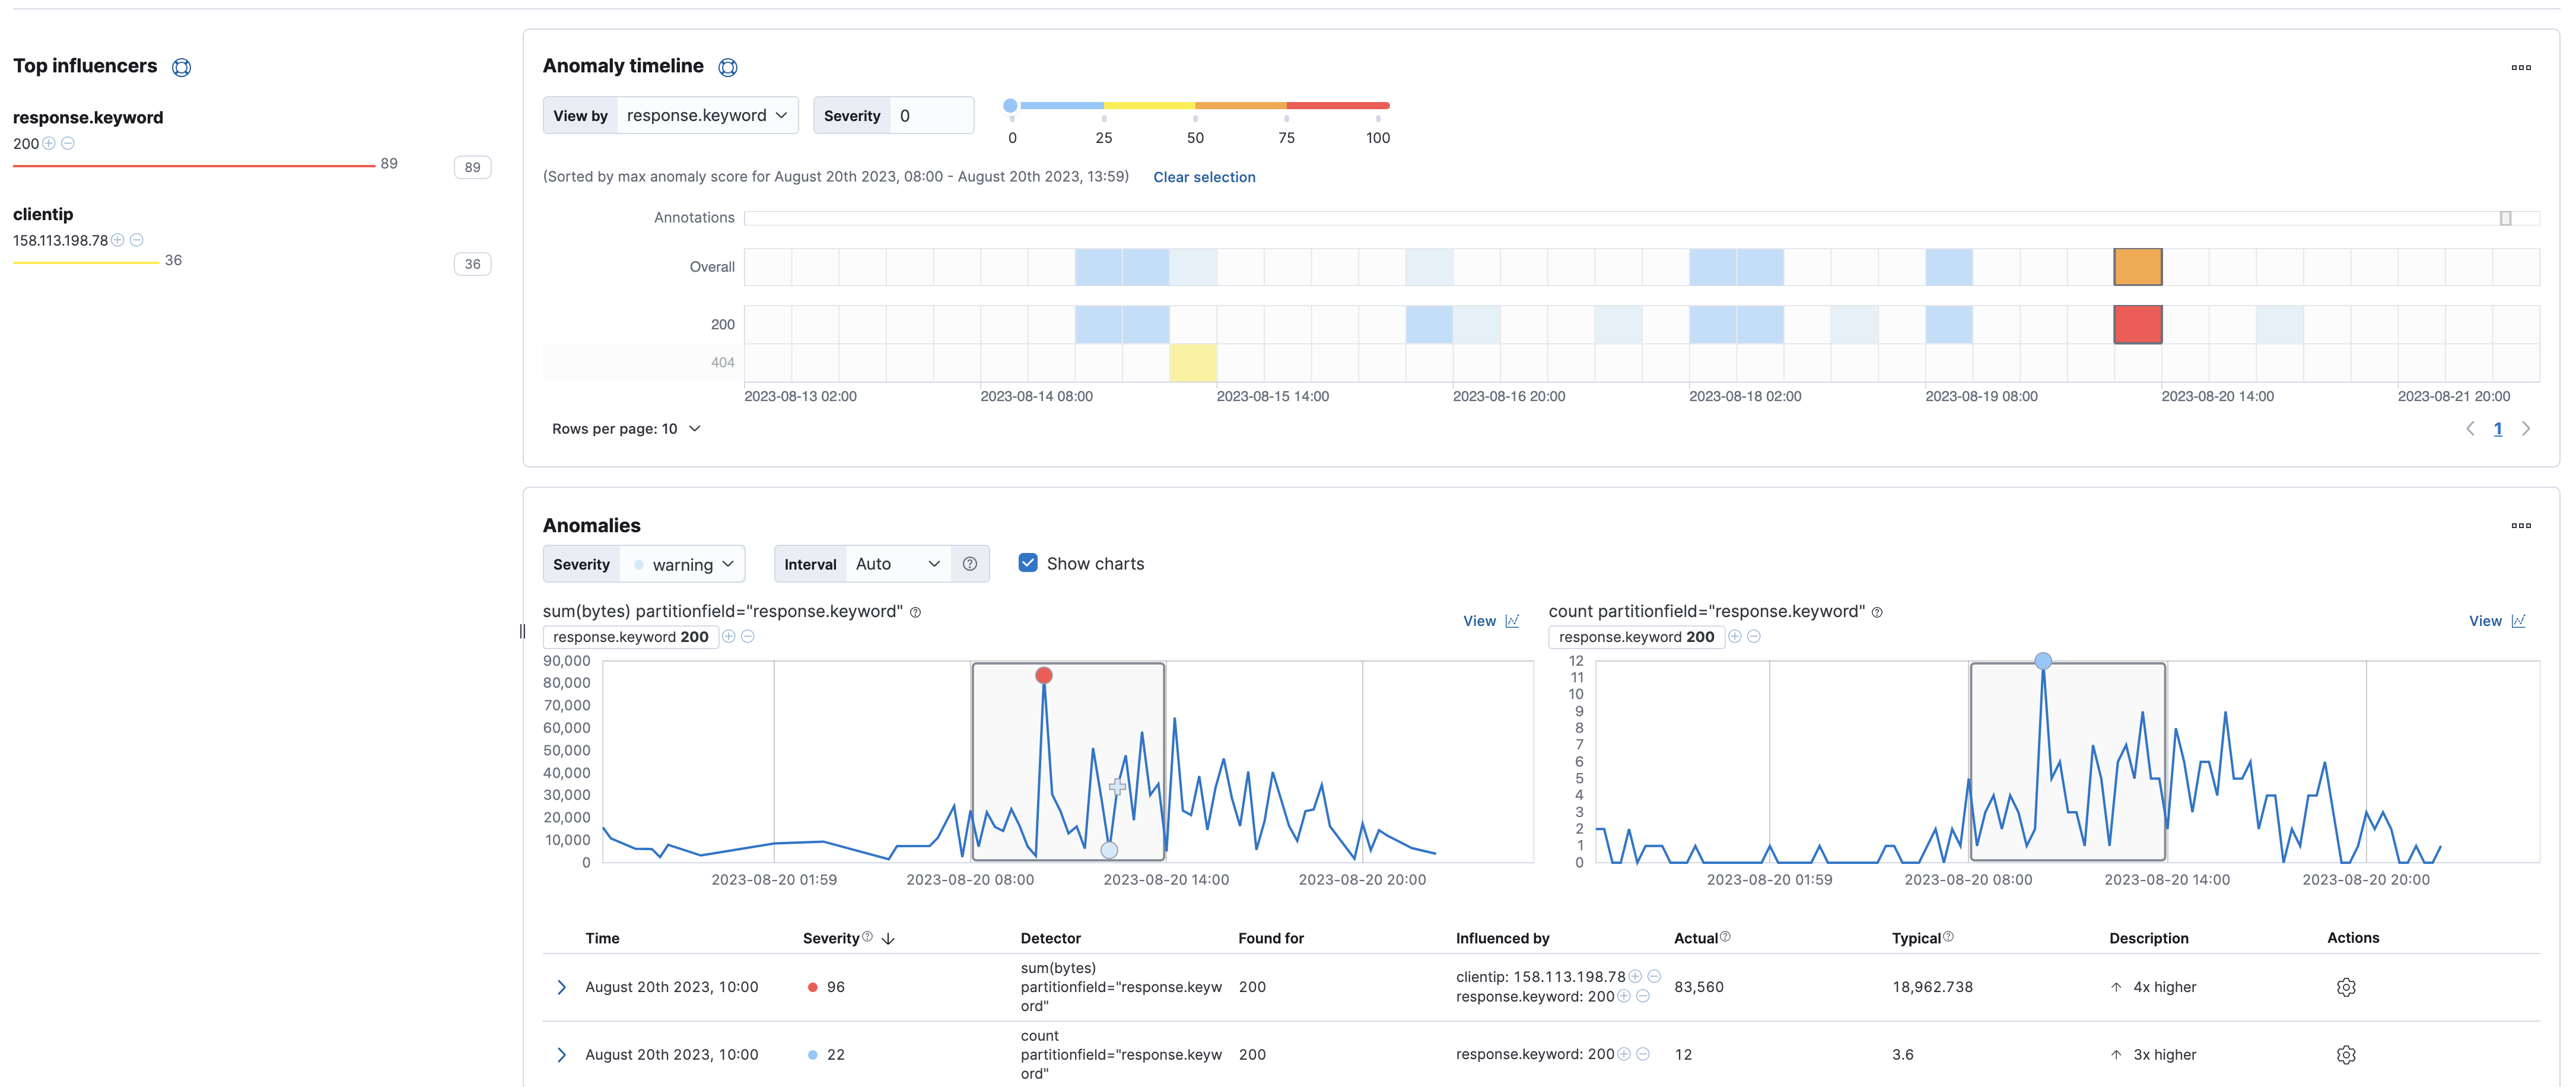
Summary:
In this lab, you create single metric and multi-metric jobs to detect anomalies in the web logs data set.