7.3: Vega
Objective:
In this lab, you will use Vega to create custom visualizations.
-
Let's take a look at a fun visualization that shows the power of Vega. Open your Logs Overview dashboard and switch to edit mode if necessary.
-
Click the Select type dropdown and then Custom visualization.
-
Delete all the JSON on the right and replace it with the following:
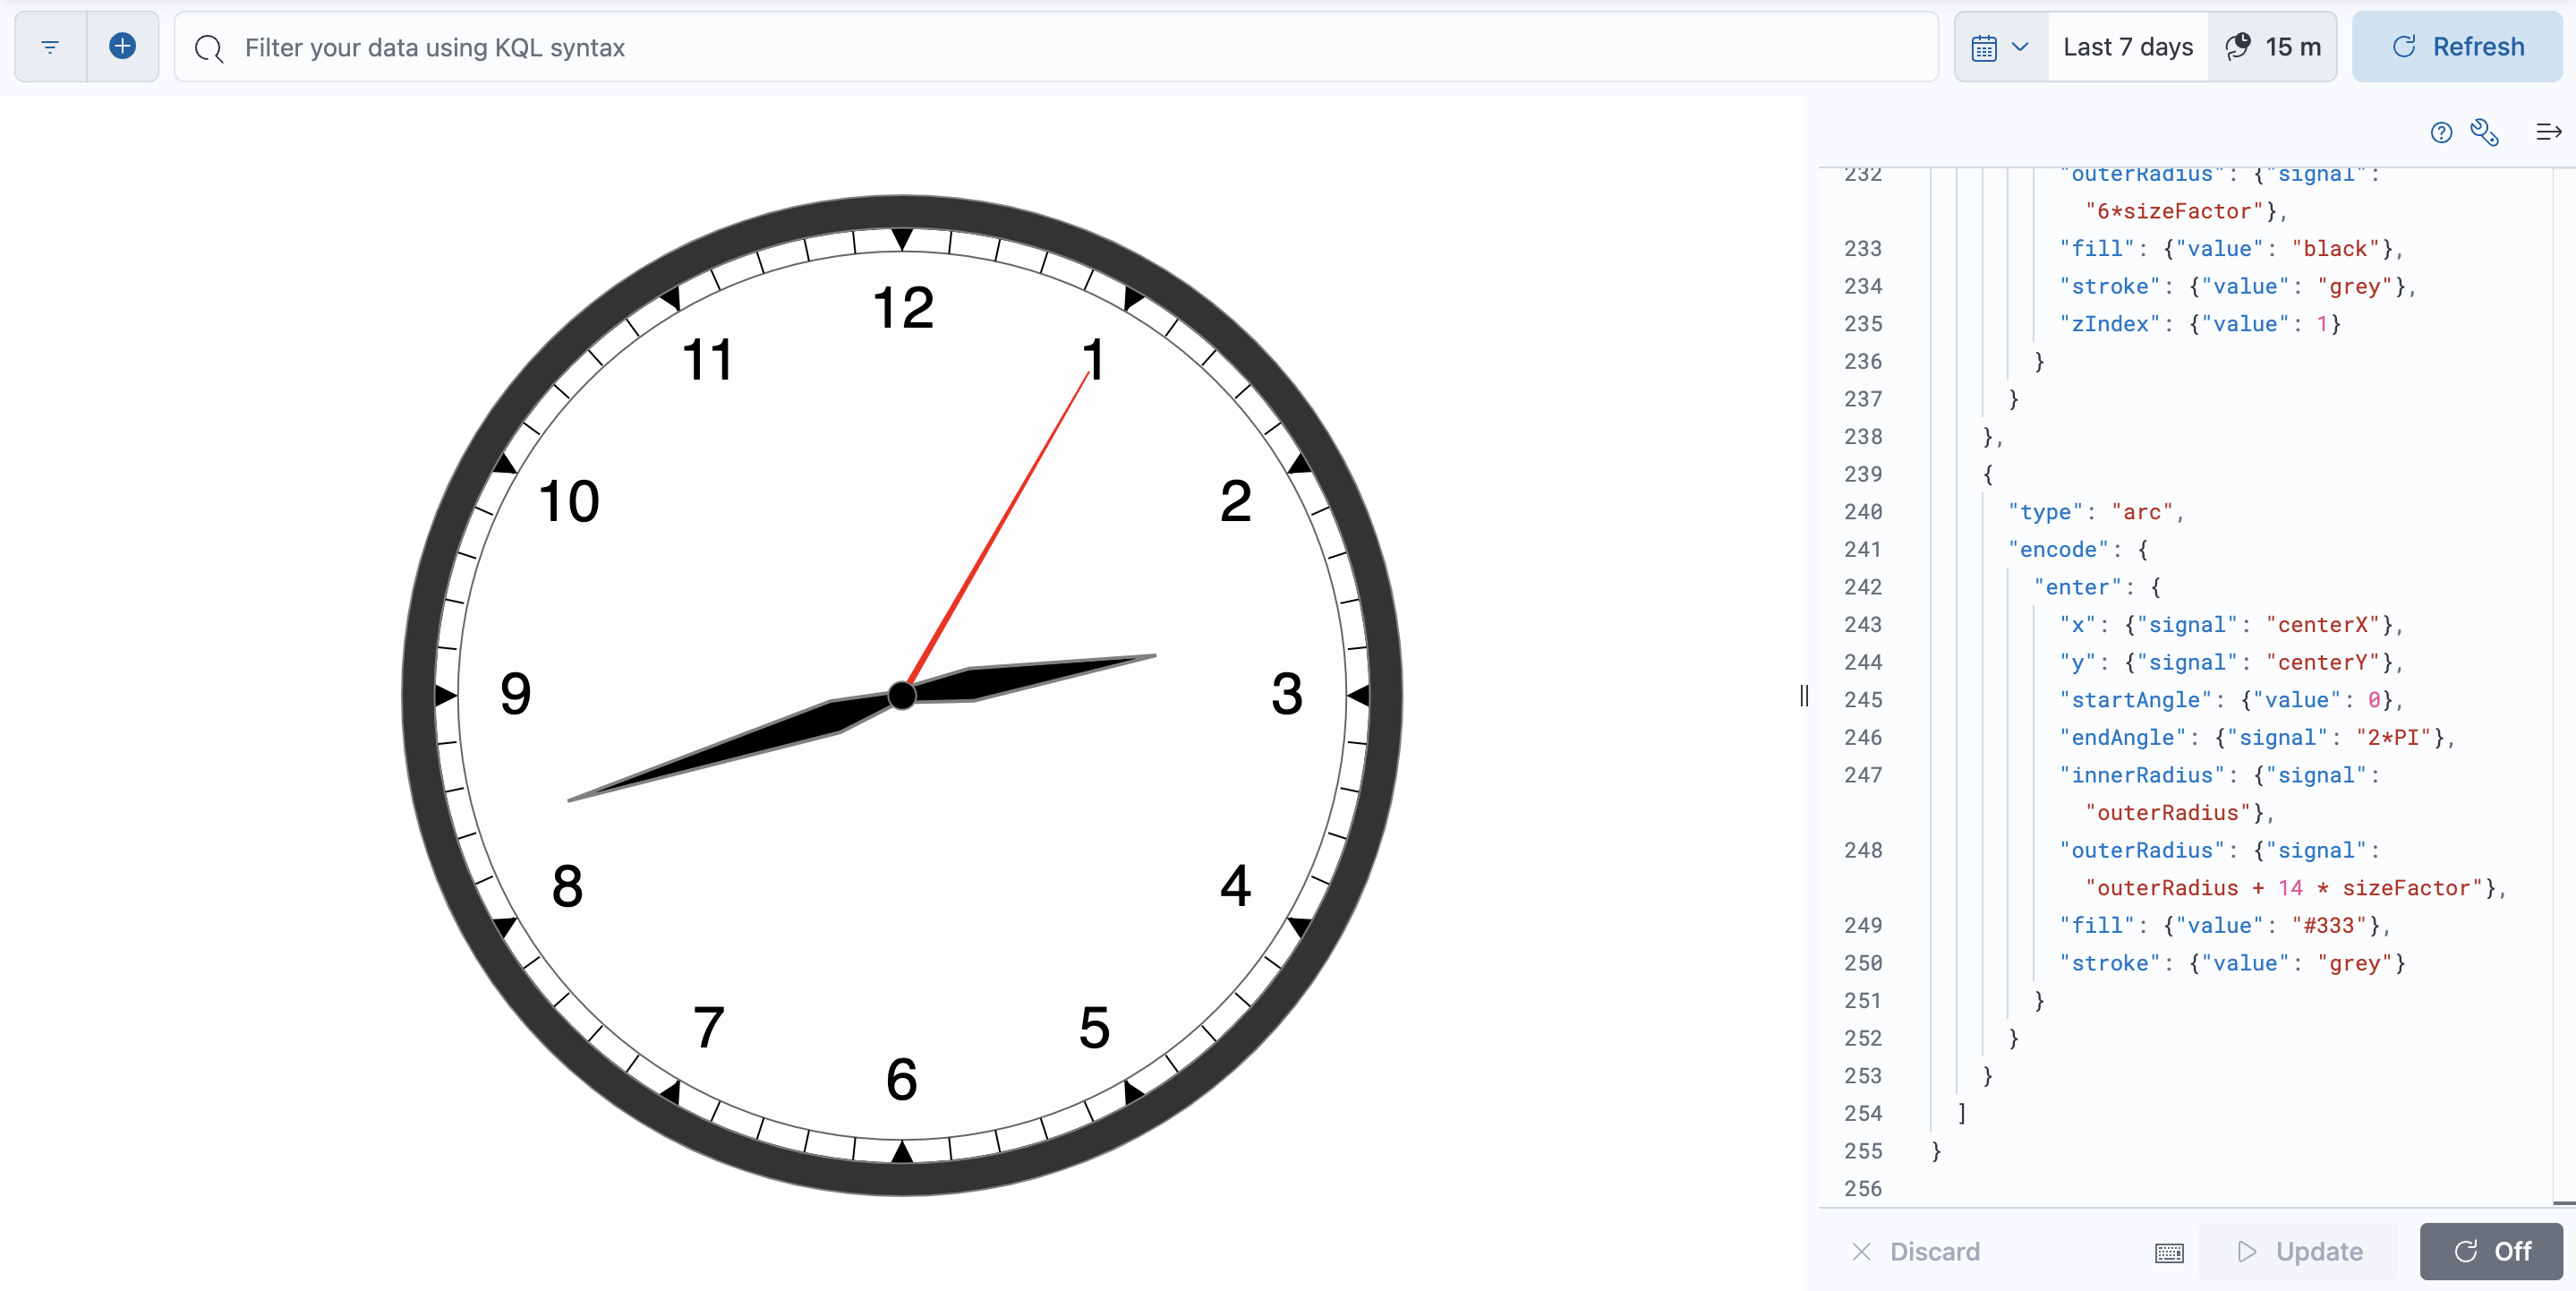
{ "$schema": "https://vega.github.io/schema/vega/v5.json", "description": "A circular clock visualization showing the current time.", "signals": [ {"name": "centerX", "init": "width/2"}, {"name": "centerY", "init": "height/2"}, {"name": "radiusRef", "init": "min(width,height)*0.8"}, {"name": "sizeFactor", "init": "radiusRef/400"}, {"name": "outerRadius", "init": "radiusRef/2"}, {"name": "innerRadius", "init": "radiusRef/2 - (10 * sizeFactor)"}, { "name": "currentDate", "init": "now()", "on": [{"events": {"type": "timer", "throttle": 1000}, "update": "now()"}] }, { "name": "currentHour", "init": "hours(currentDate)+minutes(currentDate)/60-2", "on": [ { "events": {"signal": "currentDate"}, "update": "hours(currentDate)+minutes(currentDate)/60-2" } ] }, { "name": "currentMinute", "init": "minutes(currentDate)+seconds(currentDate)/60", "on": [ { "events": {"signal": "currentDate"}, "update": "minutes(currentDate)+seconds(currentDate)/60" } ] }, { "name": "currentSecond", "init": "seconds(currentDate)", "on": [ {"events": {"signal": "currentDate"}, "update": "seconds(currentDate)"} ] } ], "data": [ { "name": "hours", "transform": [ {"type": "sequence", "start": 0, "stop": 12, "step": 1, "as": "hour"}, { "type": "formula", "expr": "centerX - cos(PI/2 + (datum.hour * PI/6)) * (outerRadius - (outerRadius-innerRadius)/2)", "as": "x" }, { "type": "formula", "expr": "centerY - sin(PI/2 + (datum.hour * PI/6)) * (outerRadius - (outerRadius-innerRadius)/2)", "as": "y" }, { "type": "formula", "expr": "centerX - cos(PI/2 + (datum.hour * PI/6)) * (innerRadius - 25 * max(sizeFactor, 0.4))", "as": "xHour" }, { "type": "formula", "expr": "centerY - sin(PI/2 + (datum.hour * PI/6)) * (innerRadius - 25 * max(sizeFactor, 0.4))", "as": "yHour" } ] }, { "name": "minutes", "transform": [ {"type": "sequence", "start": 0, "stop": 60, "step": 1, "as": "minute"}, { "type": "formula", "expr": "centerX - cos(PI/2 + (datum.minute * PI/30)) * (outerRadius - (outerRadius-innerRadius)/3)", "as": "x" }, { "type": "formula", "expr": "centerY - sin(PI/2 + (datum.minute * PI/30)) * (outerRadius - (outerRadius-innerRadius)/2)", "as": "y" } ] } ], "scales": [ { "name": "hourScale", "domain": {"data": "hours", "field": "hour"}, "range": [0, {"signal": "2*PI"}] }, { "name": "minutesScale", "domain": {"data": "minutes", "field": "minute"}, "range": [0, {"signal": "2*PI"}] } ], "marks": [ { "type": "arc", "encode": { "enter": { "x": {"signal": "centerX"}, "y": {"signal": "centerY"}, "startAngle": {"value": 0}, "endAngle": {"signal": "2*PI"}, "outerRadius": {"signal": "outerRadius"}, "fill": {"value": "transparent"}, "stroke": {"value": "black"} } } }, { "type": "arc", "encode": { "enter": { "x": {"signal": "centerX"}, "y": {"signal": "centerY"}, "startAngle": {"value": 0}, "endAngle": {"signal": "2*PI"}, "outerRadius": {"signal": "innerRadius"}, "fill": {"value": "#FCFCFC"}, "opacity": {"value": 0.6}, "stroke": {"value": "black"} } } }, { "type": "symbol", "from": {"data": "minutes"}, "encode": { "enter": { "size": {"signal": "pow(2*sizeFactor, 2)"}, "x": {"field": "x"}, "y": {"field": "y"}, "angle": {"signal": "datum.minute*6"}, "shape": {"value": "m 0 -5 v 10"}, "stroke": {"value": "black"} } } }, { "type": "symbol", "from": {"data": "hours"}, "encode": { "enter": { "size": {"signal": "pow(2*sizeFactor, 2)"}, "angle": {"signal": "datum.hour*30"}, "shape": {"value": "m -5 -5 h 10 l -5 10 l -5 -10 Z"}, "x": {"field": "x"}, "y": {"field": "y"}, "fill": {"value": "black"} } } }, { "type": "text", "from": {"data": "hours"}, "encode": { "enter": { "x": {"field": "xHour"}, "y": {"field": "yHour"}, "align": {"value": "center"}, "baseline": {"value": "middle"}, "text": {"signal": "datum.hour === 0 ? 12 : datum.hour"}, "fontSize": {"signal": "25*max(sizeFactor, 0.4)"} } } }, { "type": "symbol", "encode": { "enter": { "size": {"signal": "pow(2*sizeFactor, 2)"}, "shape": {"value": "M 0 0 h-1 l 1 -160 l 1 160 h-1"}, "x": {"signal": "centerX"}, "y": {"signal": "centerY"}, "fill": {"value": "red"}, "stroke": {"value": "red"}, "strokeSize": {"value": 2}, "strokeCap": {"value": "round"} }, "update": {"angle": {"signal": "currentSecond*6"}} } }, { "type": "symbol", "encode": { "enter": { "size": {"signal": "pow(2*sizeFactor, 2)"}, "shape": { "value": "M 0 0 h -2 l -5 -30 l 7 -120 l 7 120 l -5 30 h -2 " }, "x": {"signal": "centerX"}, "y": {"signal": "centerY"}, "fill": {"value": "black"}, "stroke": {"value": "grey"}, "strokeCap": {"value": "round"}, "strokeWidth": {"signal": "2* min(sizeFactor, 1)"} }, "update": {"angle": {"signal": "currentMinute*6"}} } }, { "type": "symbol", "encode": { "enter": { "size": {"signal": "pow(2*sizeFactor, 2)"}, "shape": {"value": "M 0 0 h-3 l -4 -30 l 7 -80 l 7 80 l -4 30 h -3"}, "x": {"signal": "centerX"}, "y": {"signal": "centerY"}, "fill": {"value": "black"}, "stroke": {"value": "grey"}, "strokeCap": {"value": "round"}, "strokeWidth": {"signal": "2* min(sizeFactor, 1)"}, "zIndex": {"value": 1} }, "update": {"angle": {"signal": "currentHour*30"}} } }, { "type": "arc", "encode": { "enter": { "x": {"signal": "centerX"}, "y": {"signal": "centerY"}, "startAngle": {"value": 0}, "endAngle": {"signal": "2*PI"}, "outerRadius": {"signal": "6*sizeFactor"}, "fill": {"value": "black"}, "stroke": {"value": "grey"}, "zIndex": {"value": 1} } } }, { "type": "arc", "encode": { "enter": { "x": {"signal": "centerX"}, "y": {"signal": "centerY"}, "startAngle": {"value": 0}, "endAngle": {"signal": "2*PI"}, "innerRadius": {"signal": "outerRadius"}, "outerRadius": {"signal": "outerRadius + 14 * sizeFactor"}, "fill": {"value": "#333"}, "stroke": {"value": "grey"} } } } ] } -
Click Update and you should now see a clock with the current time in UTC.
-
Click Save and return to add the clock to your dashboard.
-
Let's switch to something more useful and create an hourly date histogram bar chart using Vega-Lite. A great way to create Vega visualizations is to start with a good template. In the next step we will use one from the Vega-Lite example page.
-
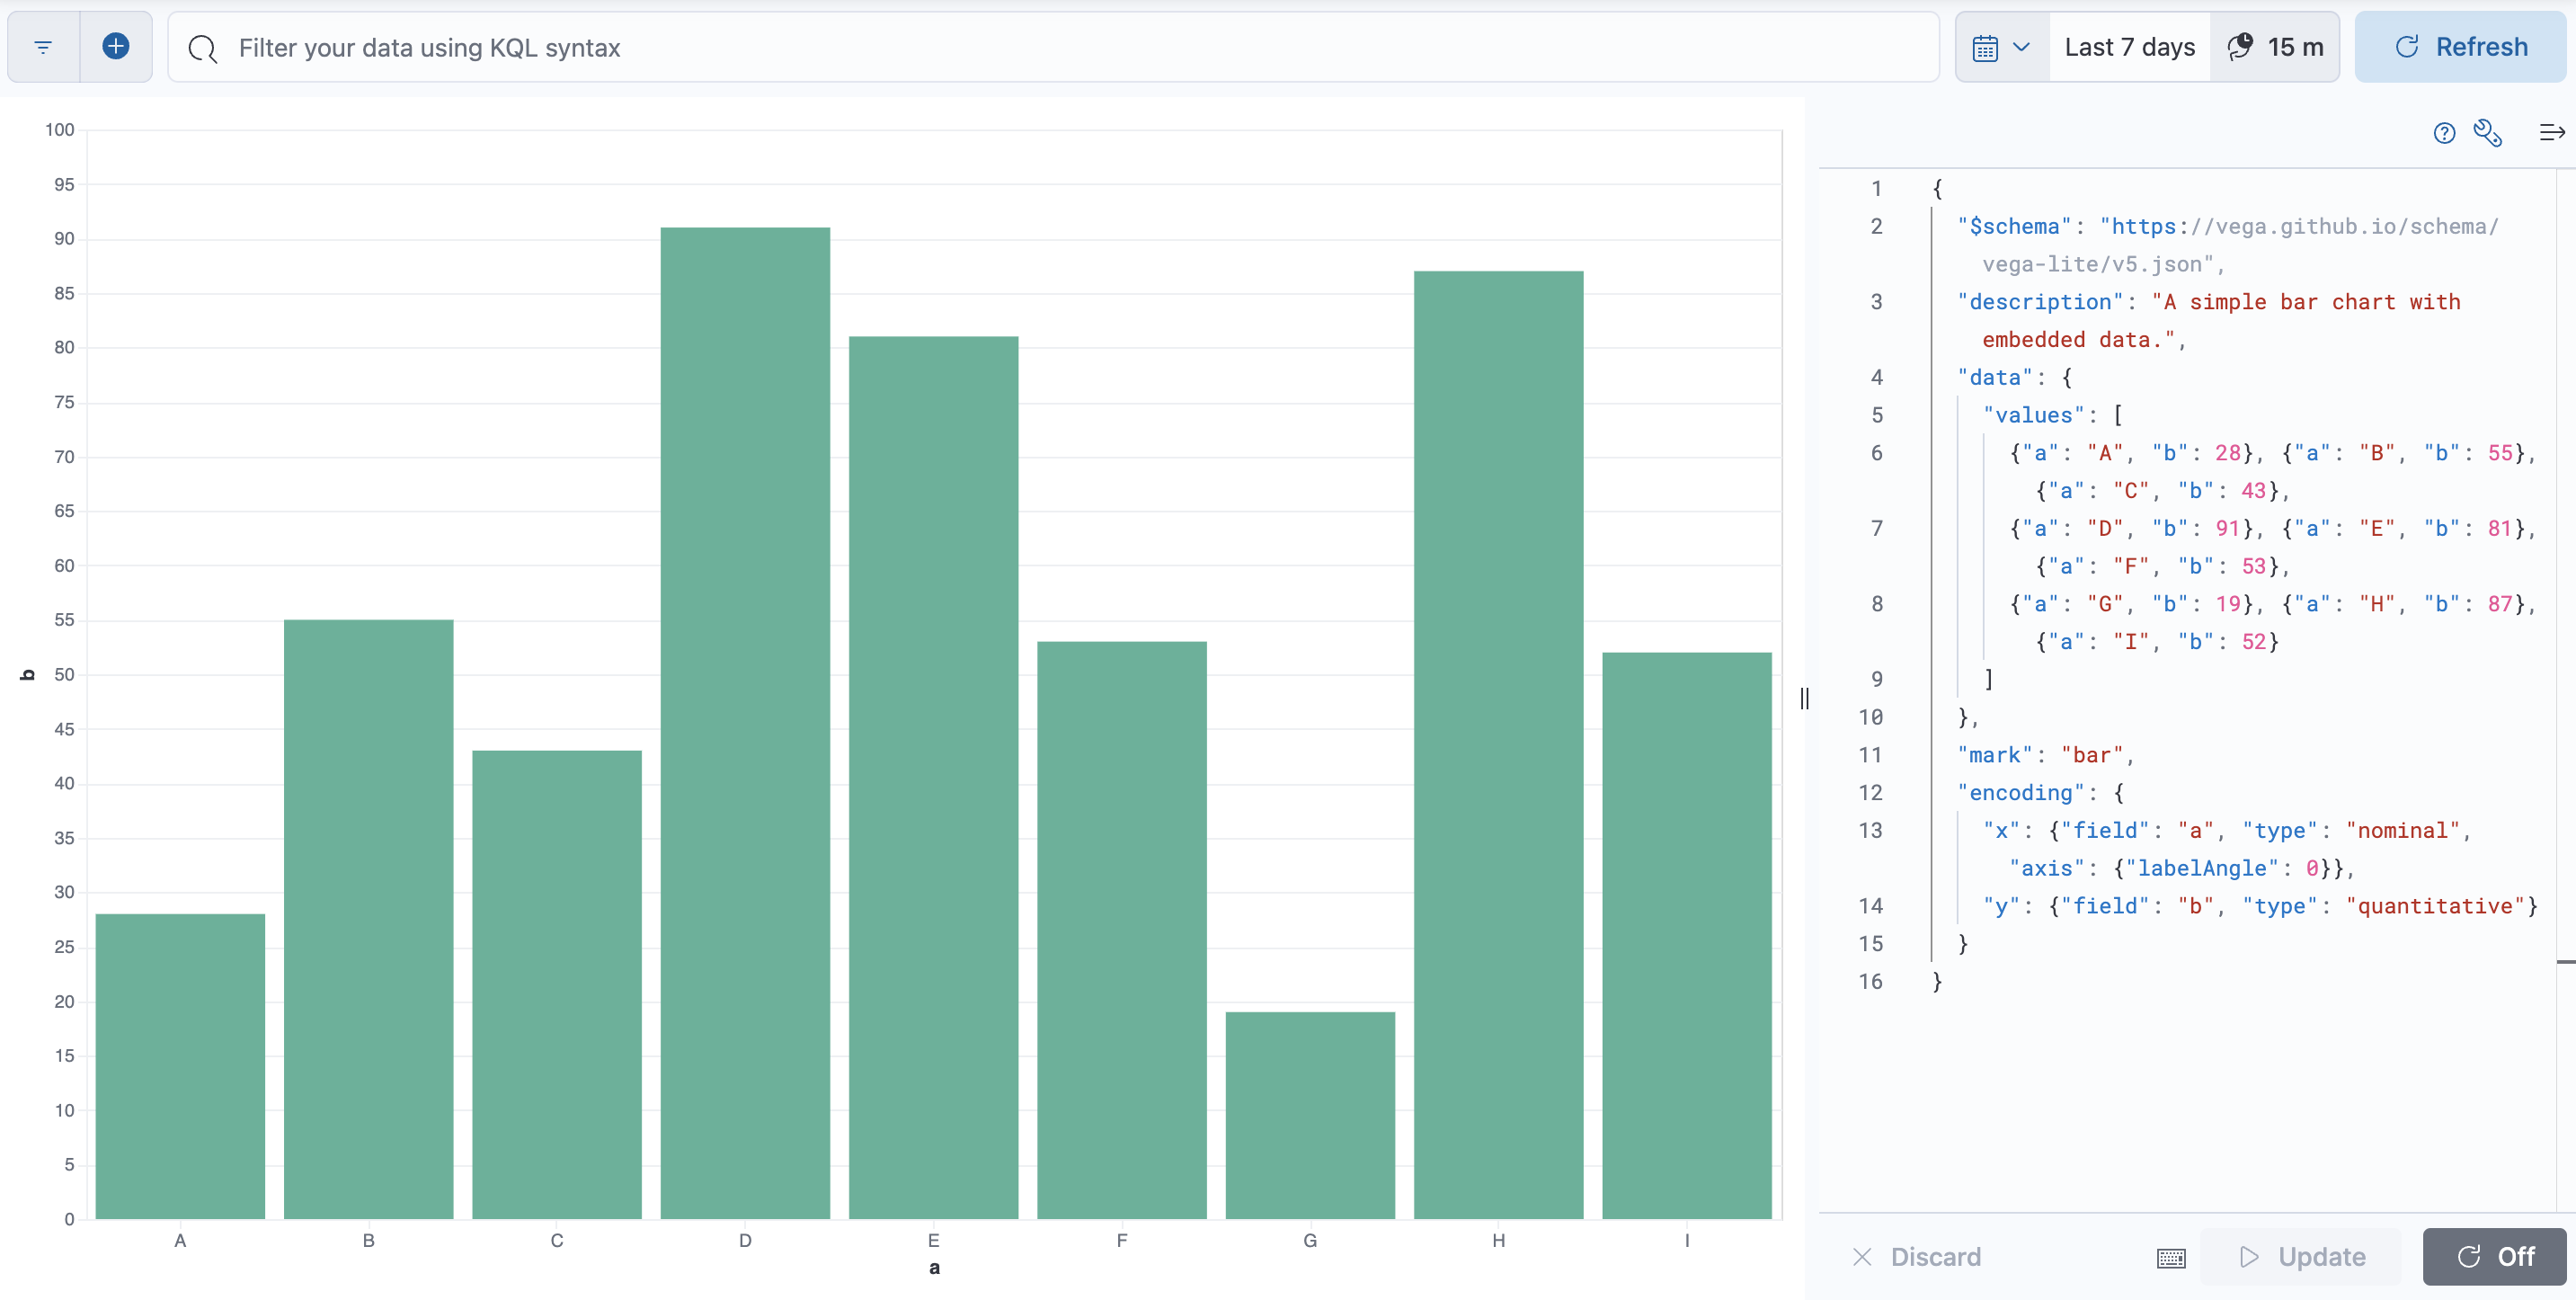
You can access the Simple Bar Chart example on Github to review, or simply copy the Vega-Lite JSON data below:
{ "$schema": "https://vega.github.io/schema/vega-lite/v5.json", "description": "A simple bar chart with embedded data.", "data": { "values": [ {"a": "A", "b": 28}, {"a": "B", "b": 55}, {"a": "C", "b": 43}, {"a": "D", "b": 91}, {"a": "E", "b": 81}, {"a": "F", "b": 53}, {"a": "G", "b": 19}, {"a": "H", "b": 87}, {"a": "I", "b": 52} ] }, "mark": "bar", "encoding": { "x": {"field": "a", "type": "nominal", "axis": {"labelAngle": 0}}, "y": {"field": "b", "type": "quantitative"} } } -
Go back to the Logs Overview dashboard. Click the Select type dropdown and then Custom visualization.
-
Delete the JSON on the right and replace it with the specification you just copied.
-
Click Update and you should now see the same bar chart that was shown on the Vega-Lite example page.
-
This visualization is using inline data values that are embedded in the JSON. Let's replace these values with data from Elasticsearch. First, remove the
valuesarray from thedatasection and you will end up with an emptydatasection: -
Next, add to the
datasection a request template to query Elasticsearch, consisting of:- a
urlclause with a%timefield%,indexandbodyproperty - a
formatclause with apropertyproperty:
- a
-
Then, configure each one of the four properties you just included as follows:
- set
url.%timefield%to@timestamp - set
url.indextokibana_sample_data_logs - set
url.bodyto: This is what a request to Elasticsearch looks like (out of scope for this course, but covered in the Elasticsearch Engineer course). - set
format.propertytoaggregations.my_histogram.buckets. This is what the response from Elasticsearch will look like.
- set
-
Finally, adjust
encodingas follows:- set the
x.fieldtokeyandx.typetotemporal(because it is a datetime parameter) - set the
y.fieldtodoc_count
- set the
-
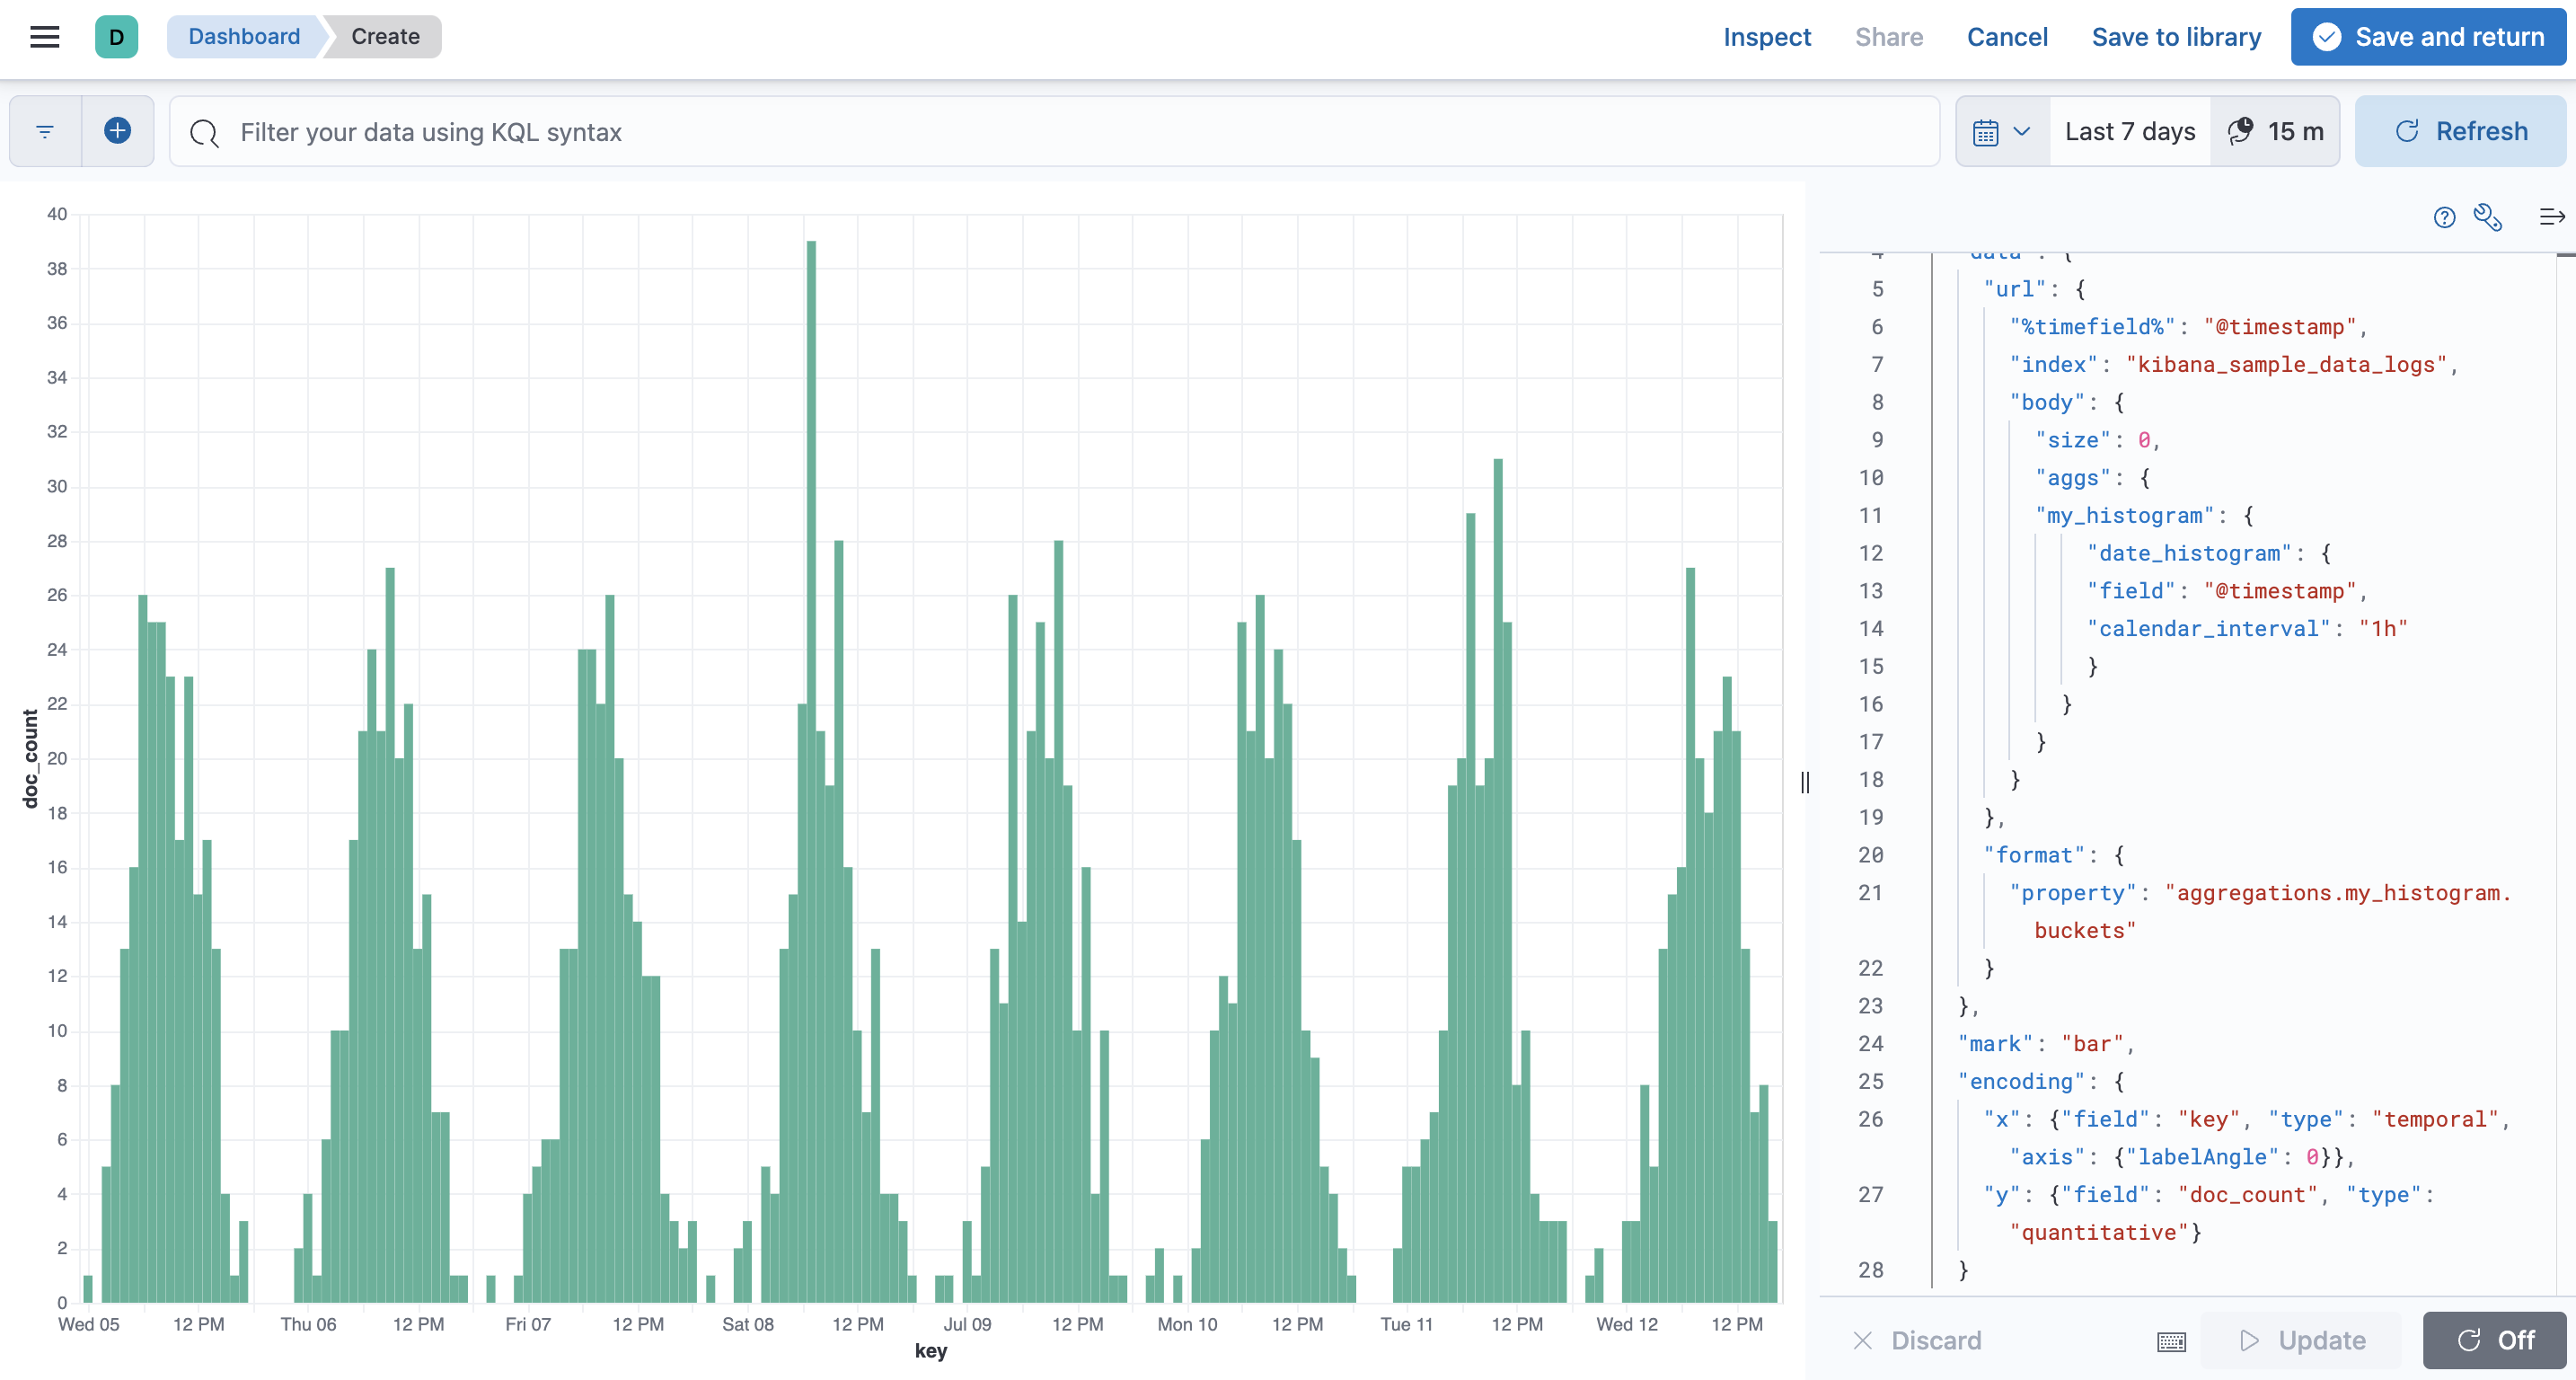
The final request should look like the one below.
{ "$schema": "https://vega.github.io/schema/vega-lite/v5.json", "description": "A simple bar chart with embedded data.", "data": { "url": { "%timefield%": "@timestamp", "index": "kibana_sample_data_logs", "body": { "size": 0, "aggs": { "my_histogram": { "date_histogram": { "field": "@timestamp", "calendar_interval": "1h" } } } } }, "format": { "property": "aggregations.my_histogram.buckets" } }, "mark": "bar", "encoding": { "x": {"field": "key", "type": "temporal", "axis": {"labelAngle": 0}}, "y": {"field": "doc_count", "type": "quantitative"} } } -
Click Update and you should now see an hourly histogram of the sample log data.
-
Click Save and return to add the visualization to your dashboard. Next, save the dashboard.
Summary:
In this lab, you have explored Vega by creating some custom visualizations.