8.2: In-App Alerts
Objective:
In this lab, you will learn how to define Alerts from Machine Learning as well as rely on other ways to create Alerts within Kibana. You will also create a new connector that integrates with Slack and understand how to use this as an additional action for an existing Alert.
-
First, access Machine Learning.
- > Analytics > Machine Learning
-
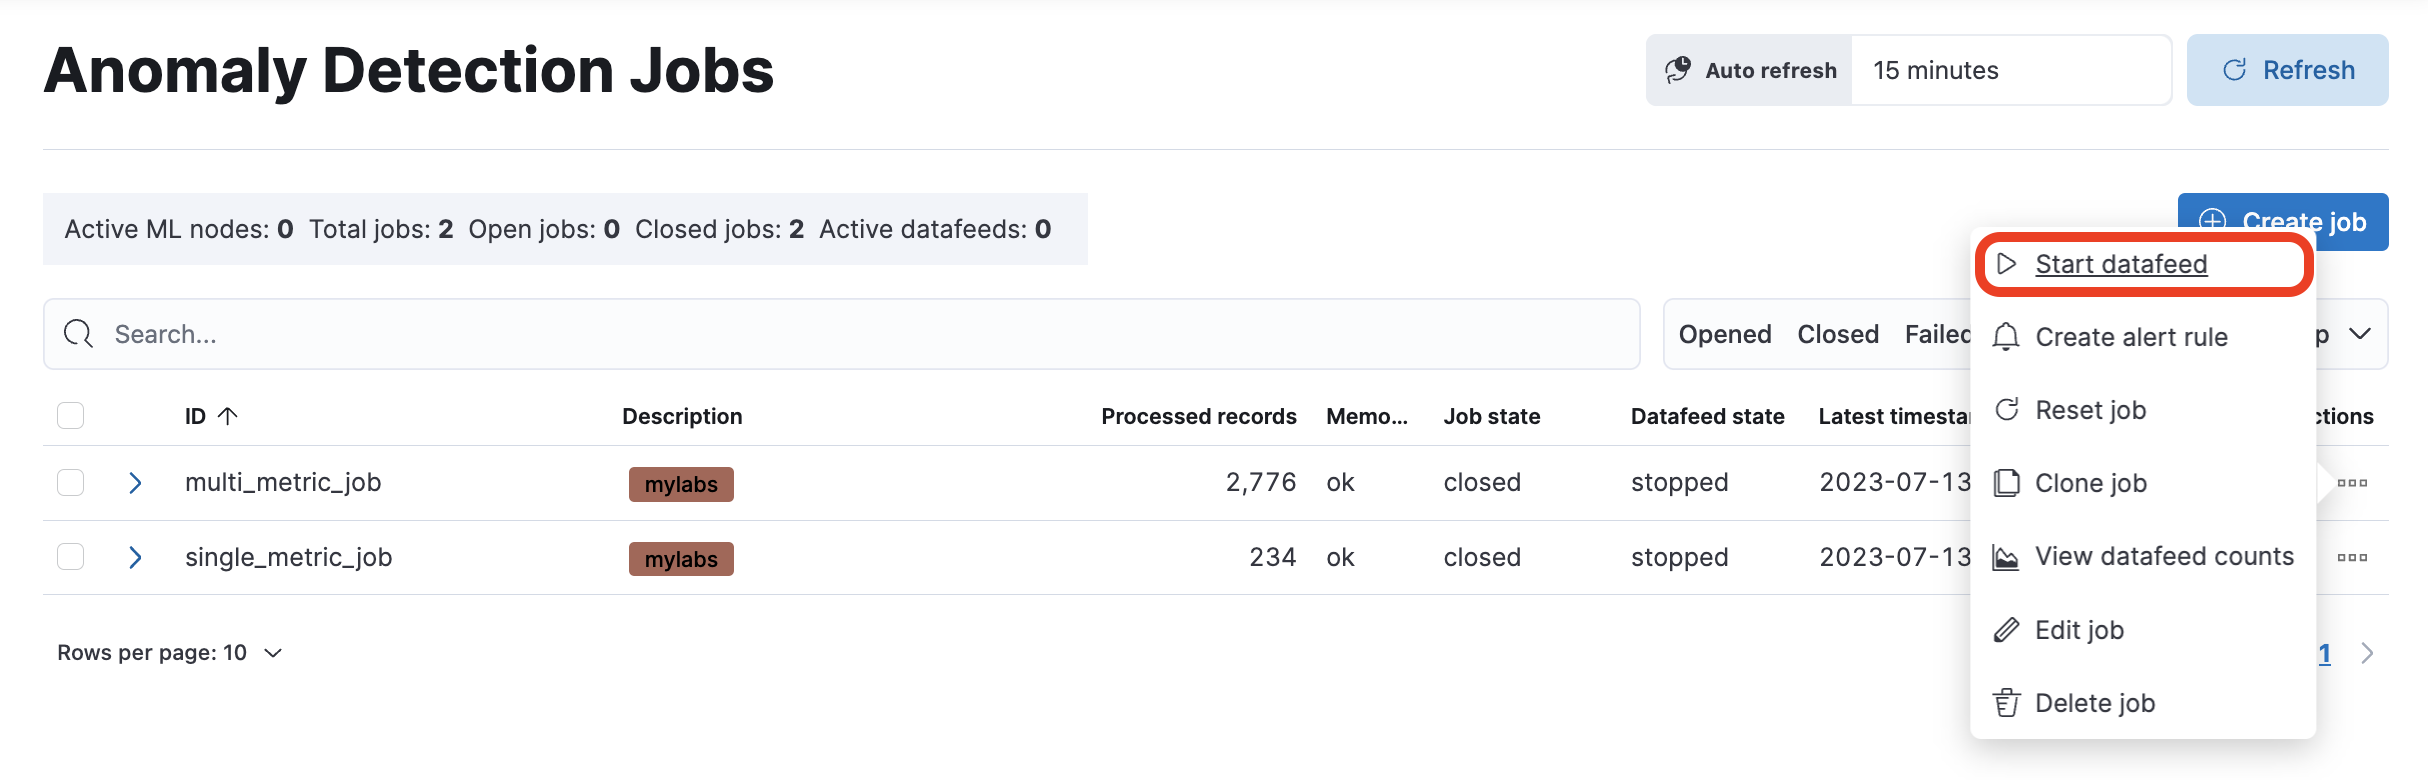
Click Jobs under Anomaly Detection in the left side panel. In this page, you will see listed the two jobs that you created previously. Next, you will configure an alert rule.
-
First, you need to start a datafeed for the multi-metric job you created earlier. For the multi_metric_job, click the three dots at the end of the row and select Start datafeed.
-
In the new pop-up window, select the search start and end time as follows.
- Keep the default start time
- Select No end time (Real-time search) for end time
- Toggle on Create alert rule after datafeed has started
- Click Start
-
The Create rule panel will open on the side. Start creating a new rule with the following settings:
- The name is
my_rule - Select Record under Result type
- Slide the severity to
50.
- The name is
-
Scroll down to the Actions section and select the Email connector type that you have already used in the previous lab.
-
Enter your email address under To and enter
Alertas the Subject. -
Click Save.
-
To test getting an alert email, you can manually create an anomaly in the data. To do that, access Dev Tools from the main menu (under Management).
-
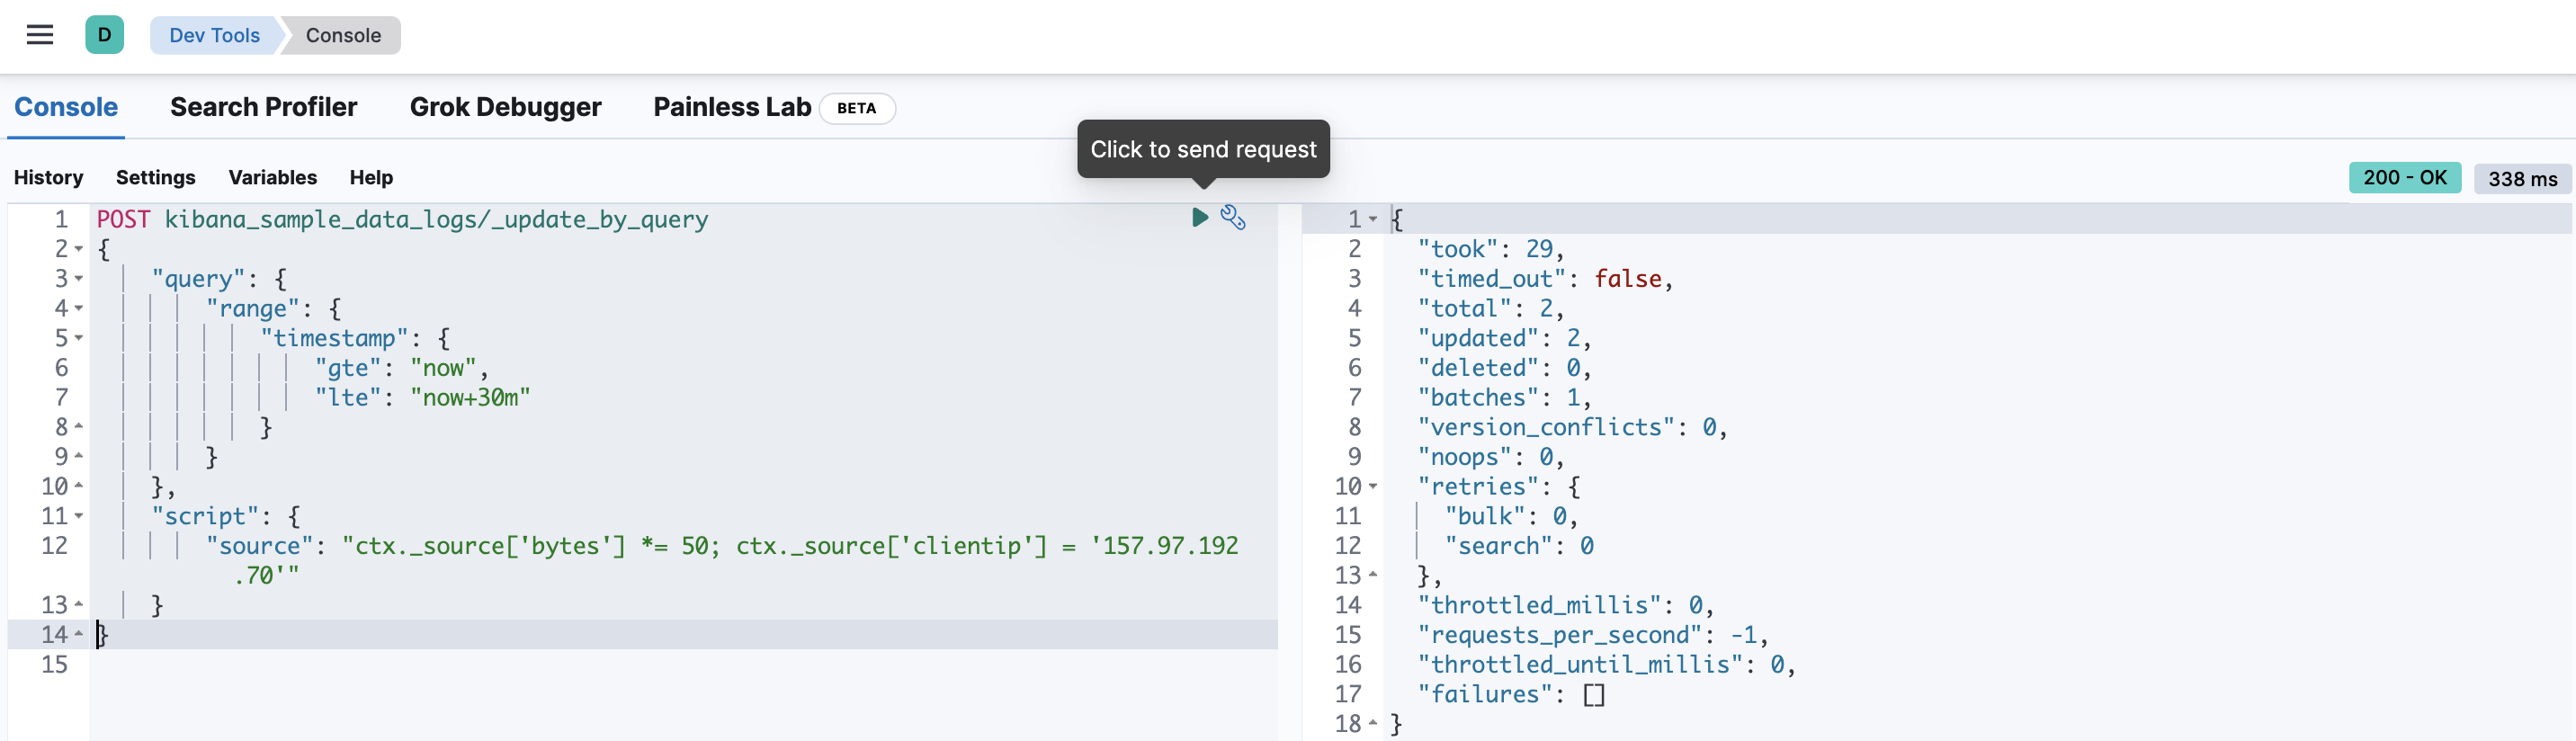
On the left side, copy and paste the following request. This will increase the number of bytes in the coming 30 minutes, which will be detected as an anomaly.
-
Run the request by clicking the play button.
-
It will take up to 30 minutes for the alert email to arrive. Note it may end up in your spam box. When the email arrives, you will be able to click Open in Anomaly Explorer in that email to inspect the anomaly that caused the alert.
-
You will learn now how to create a simple Inventory Threshold alert relying on the new Alert integration in Discover.
-
Start by accessing Discover.
- > Analytics > Discover
-
Set Discover to use the Kibana Sample Data Logs data view for the Last 7 days, and ensure the query bar is empty. Your view should look like this:
 Note: you may already have this view from the previous lab.
 -
In the query bar, search for all the events that contain a not found error. Note:
Status code is stored in the response field. -
Let's create now a Rule that would trigger an Alert whenever the events with not found errors is over 100 for the Last 7 days.
-
Click Alerts in the tool bar on the top right of Discover. Then, select Create search threshold rule.

-
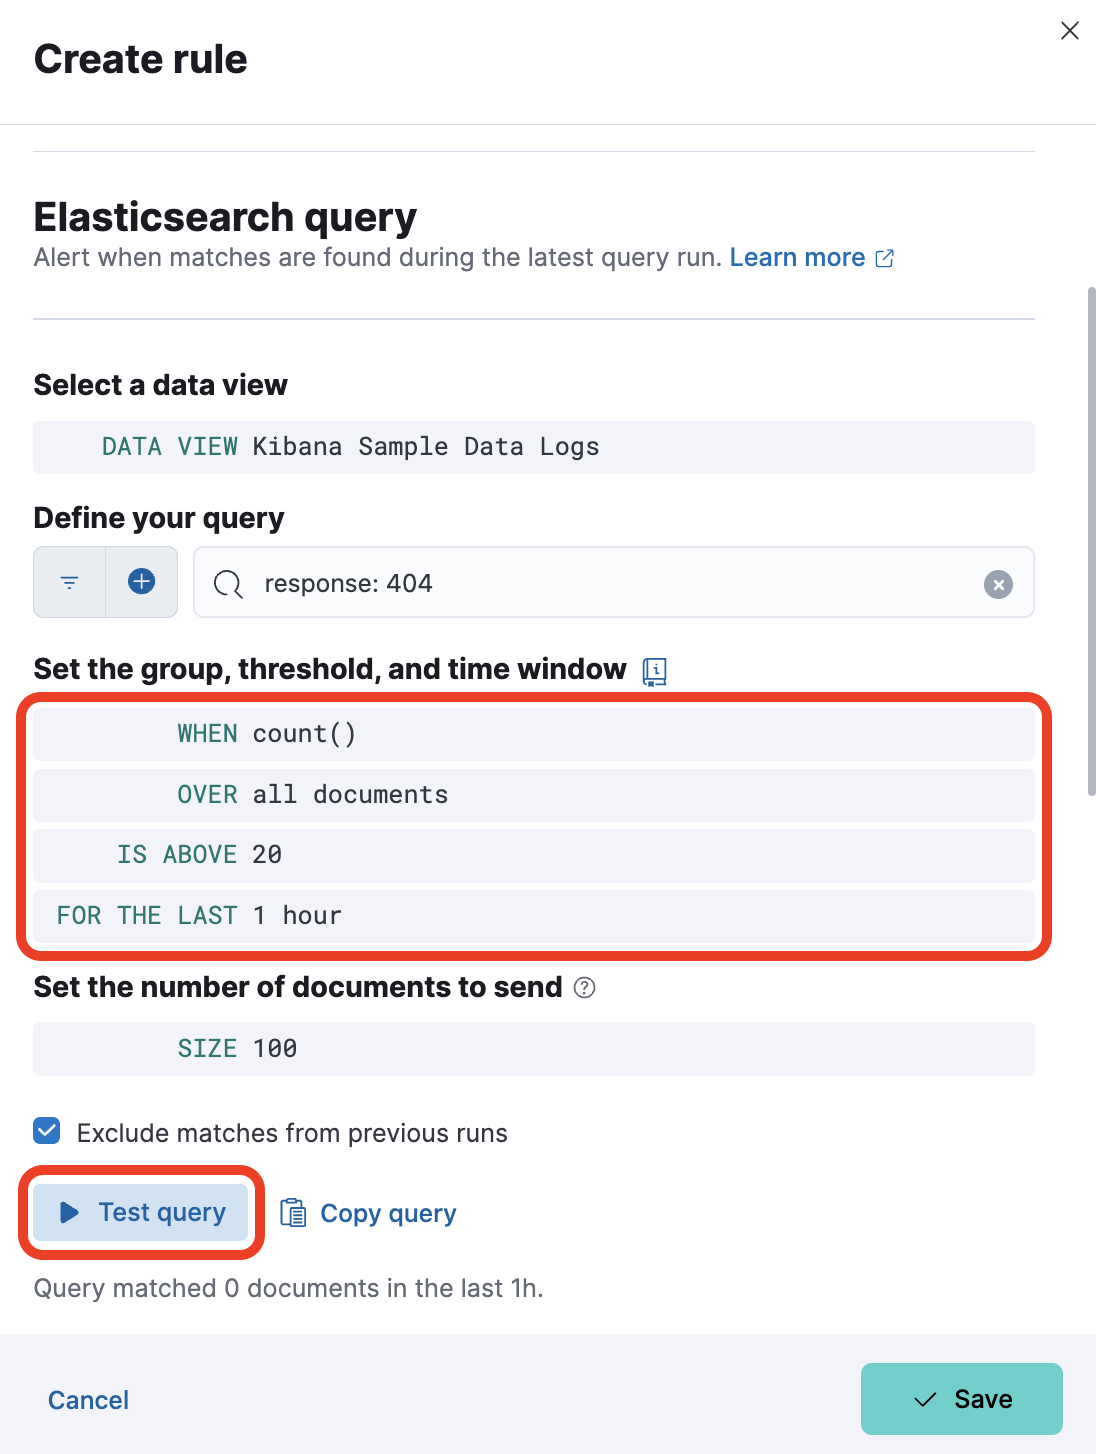
The Create rule panel will open on the side and it is preconfigured with Index Threshold settings. Start creating a new rule with the following settings:
- set Name to
Error Threshold - set IS ABOVE to
20 - set FOR THE LAST to
1 hour - set Check every to
15 minutes
- set Name to
-
Before creating your alert, use the Test query button to check how many documents match the query. As you can see, the configuration comes with the query you typed in the search bar already set up.
-
Select Email as action type, specify the To and Subject fields, and then click Save.
-
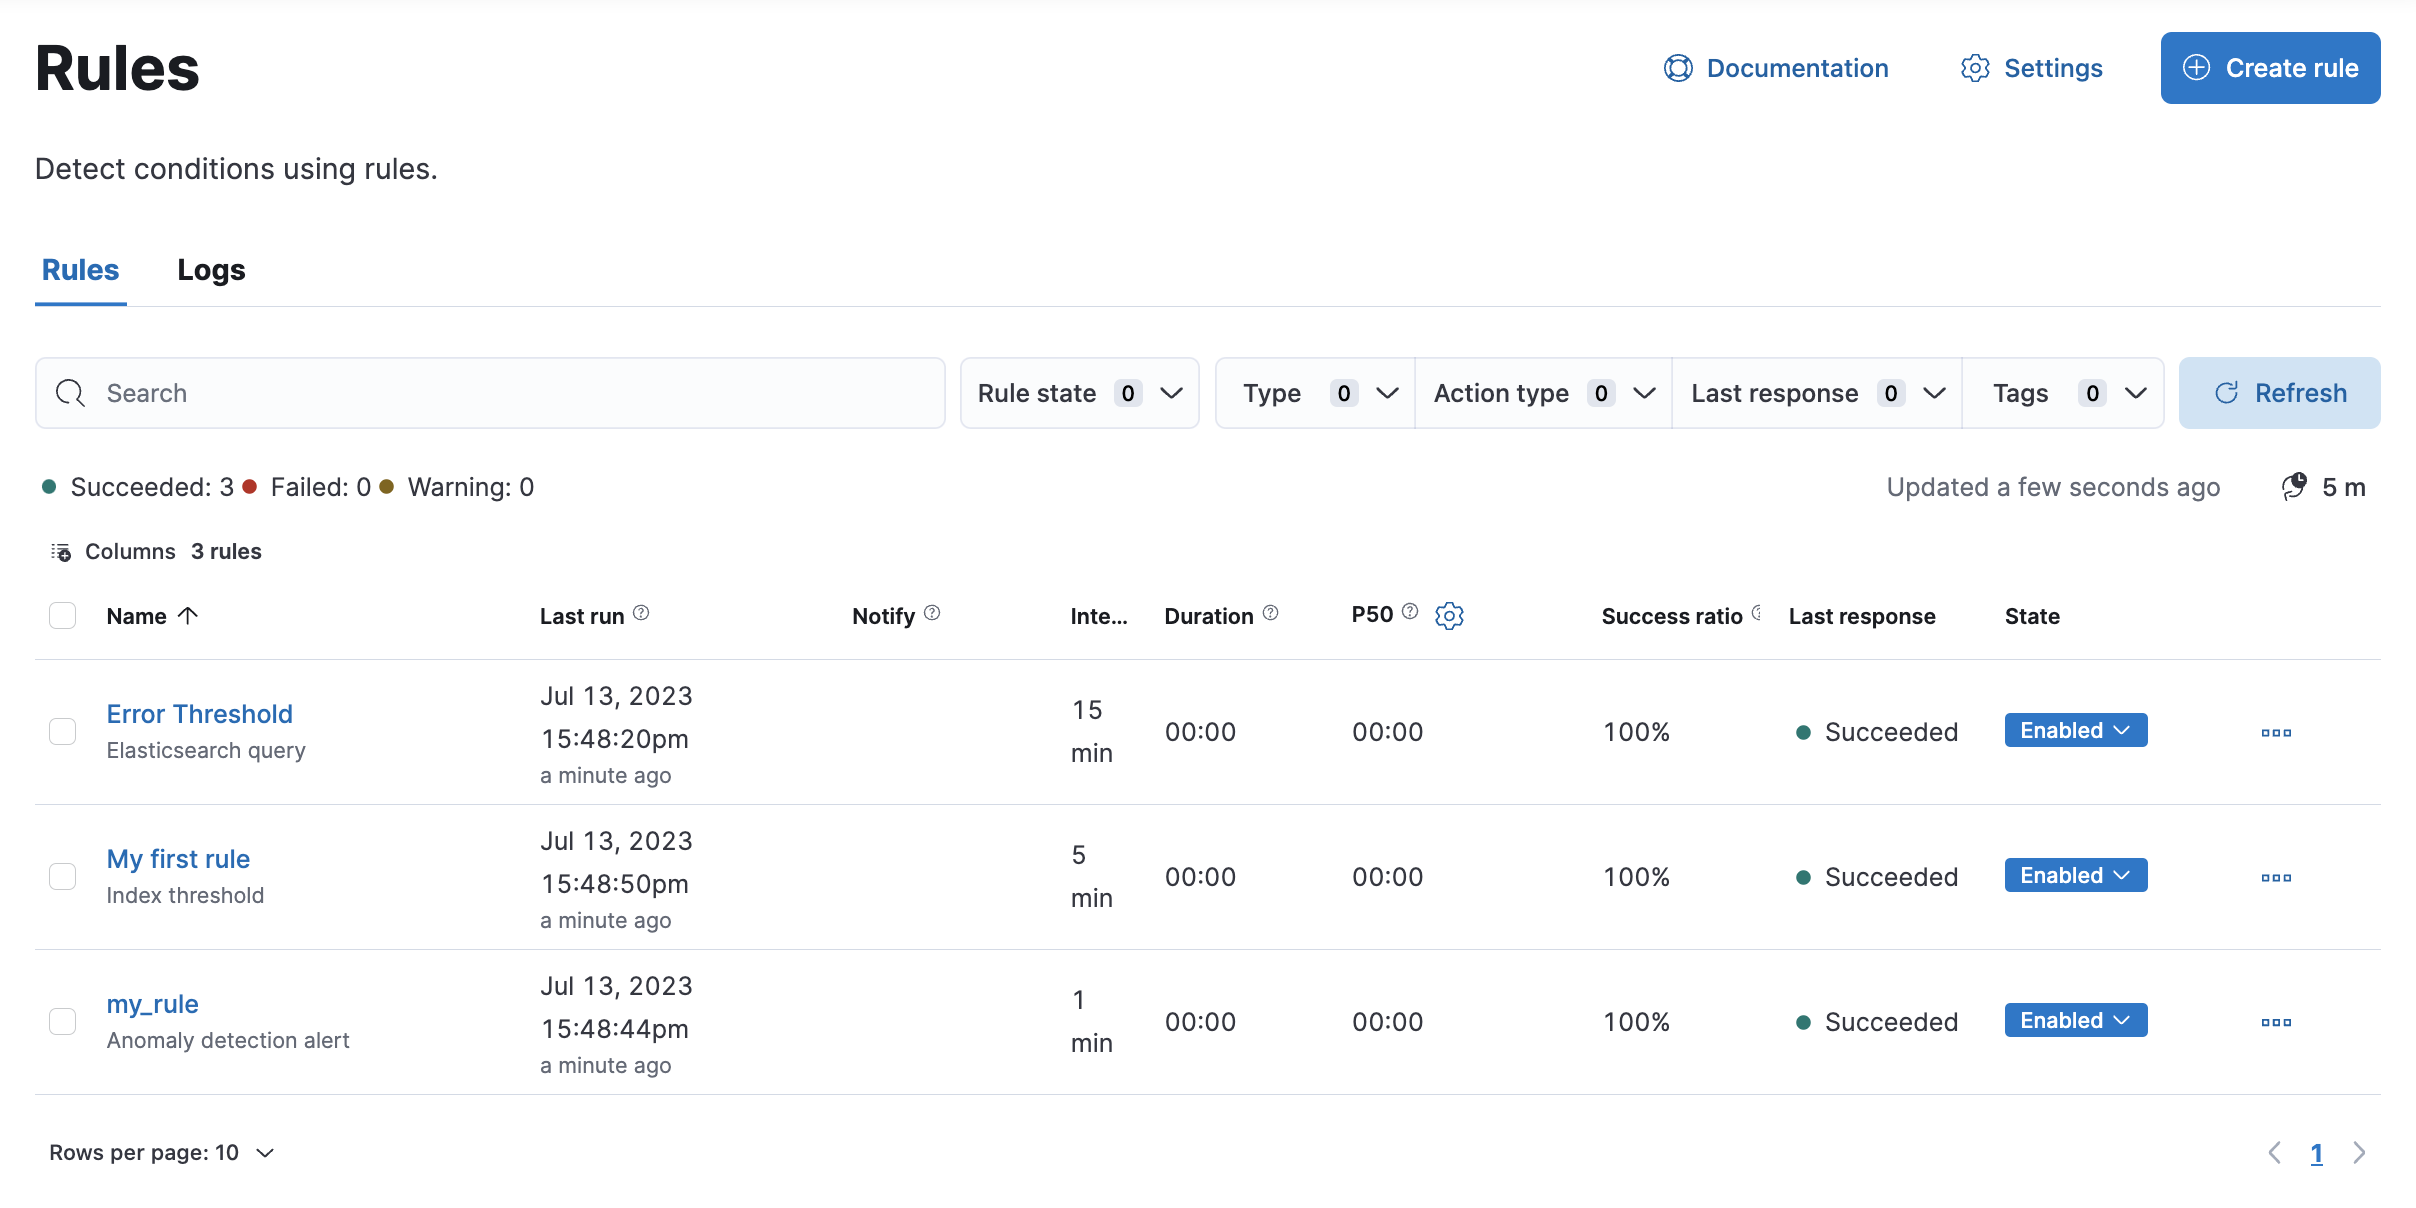
The Rule is now created and will appear in Kibana Alerting. Open it by acessing:
- > Stack Management > Alerts and Insights > Rules
- > Stack Management > Alerts and Insights > Rules
-
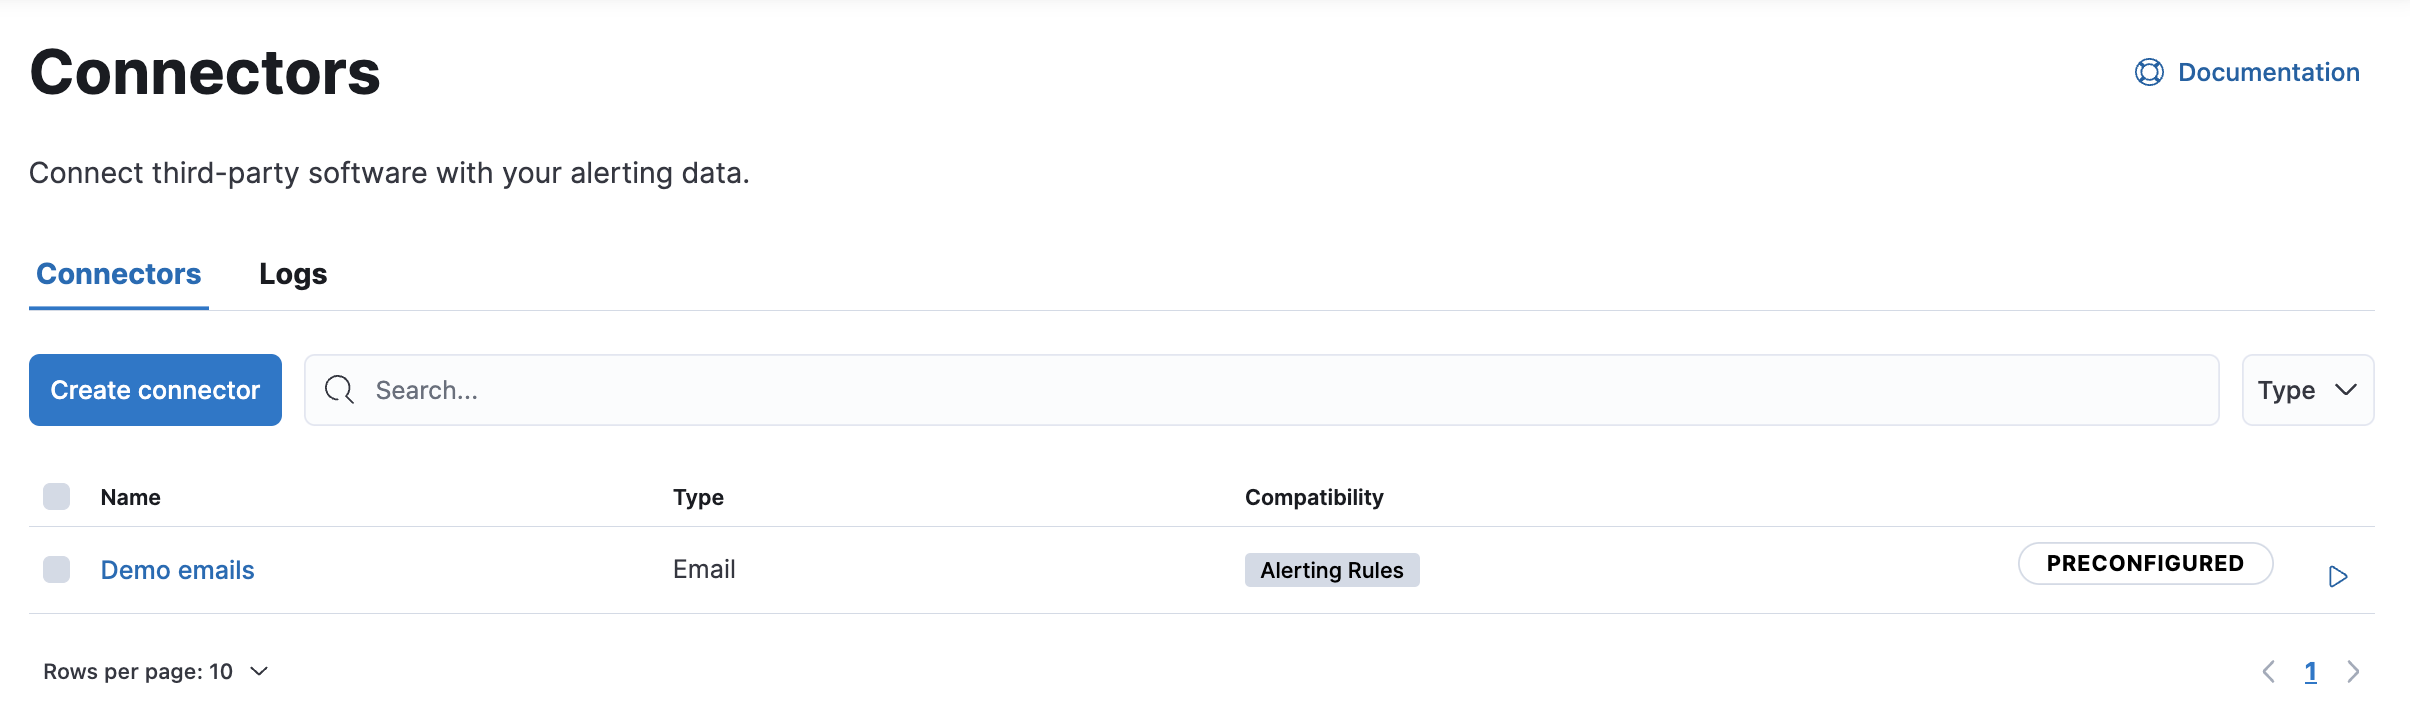
Let's see now how to create a new connector that will integrate with Slack and how to use it. First, access Connectors under Alerts and Insights.
-
Next, click Create connector.
-
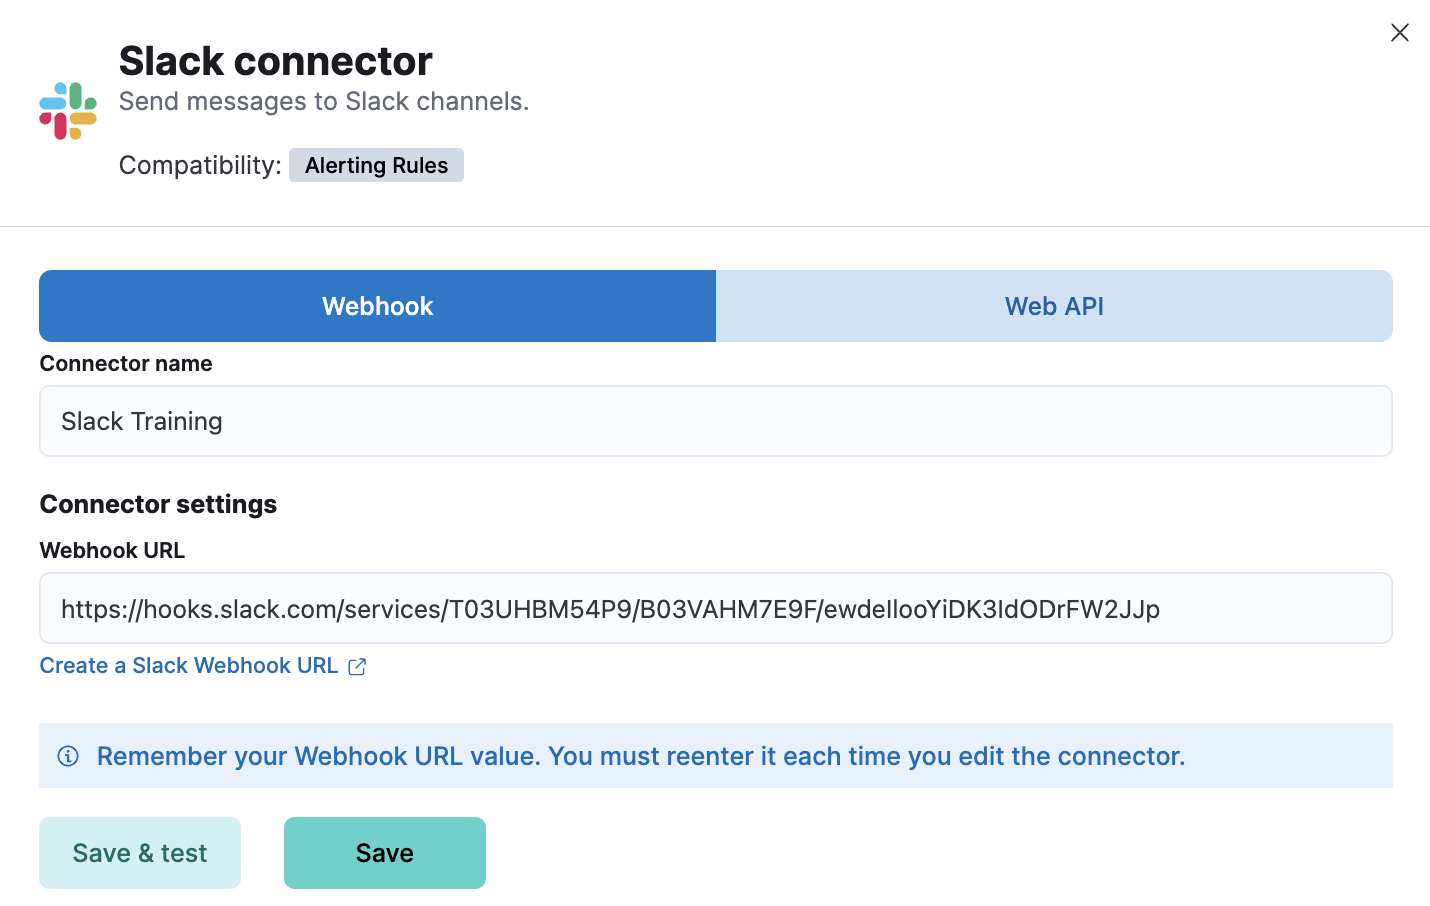
Inside the Select a connector panel, select Slack and set it up with the following settings:
- Connector Name: Slack Training
- Webhook url:
-
Once done, click Save.
-
Now that your new connector has been created, go back to the Rules page and edit My first rule. Do this by clicking the "" to the right and clicking Edit rule.
-
Scroll down untill the Select a connector type section and select Slack as the connector type.
-
The connector settings come preconfigured with the Slack Training connector we just created. Replace the content of the Message section with the following:
alert '{{alertName}}' created by STUDENT_NAME has been triggered:

- Value: {{context.value}}
- Conditions Met: {{context.conditions}} over {{params.timeWindowSize}}{{params.timeWindowUnit}}
- Timestamp: {{context.date}}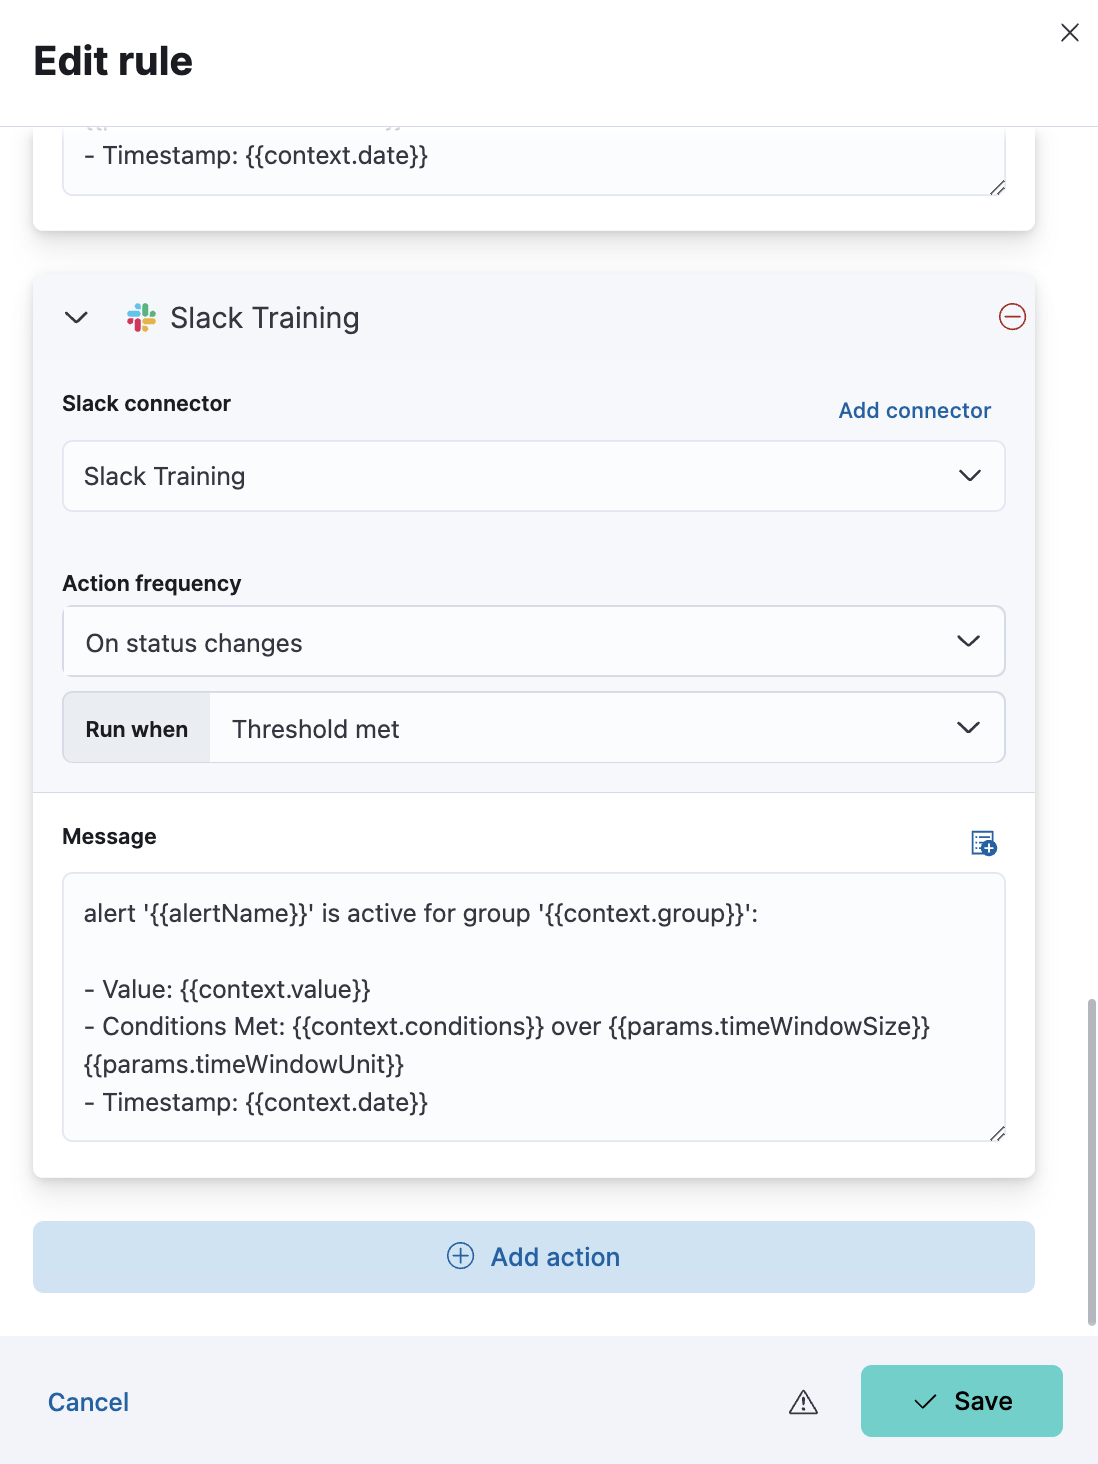
-
Replace "STUDENT_NAME" with your name or nickname and click Save.
-
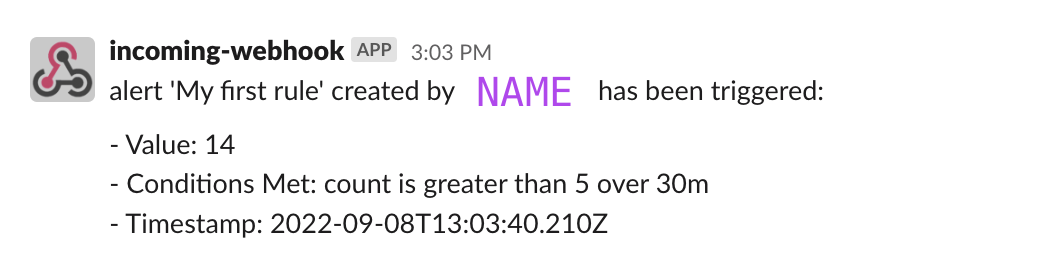
If you want to verify that your Alert has been correctly triggered you can join the slack channel created for this course by using this direct link. Your message should look like the following.
Summary:
In this lab, you've learned how to use the results of machine learning jobs, and you have configured a rule that will alert you via email when an anomaly occurs. You also understood how to create pre-configured Alerts with the in-App feature available within the Discover interface. Furthermore, you have learned how it is possible to add additional Actions to an existing Alert with the integration of Slack.