6.2: Analyzing Results
Objective:
In this lab, you will see how you can use the results of machine learning jobs. Next, you will configure a rule so you will be alerted when an anomaly is detected in your data.
-
First, you will add the single metric's job swim lane to your dashboard.
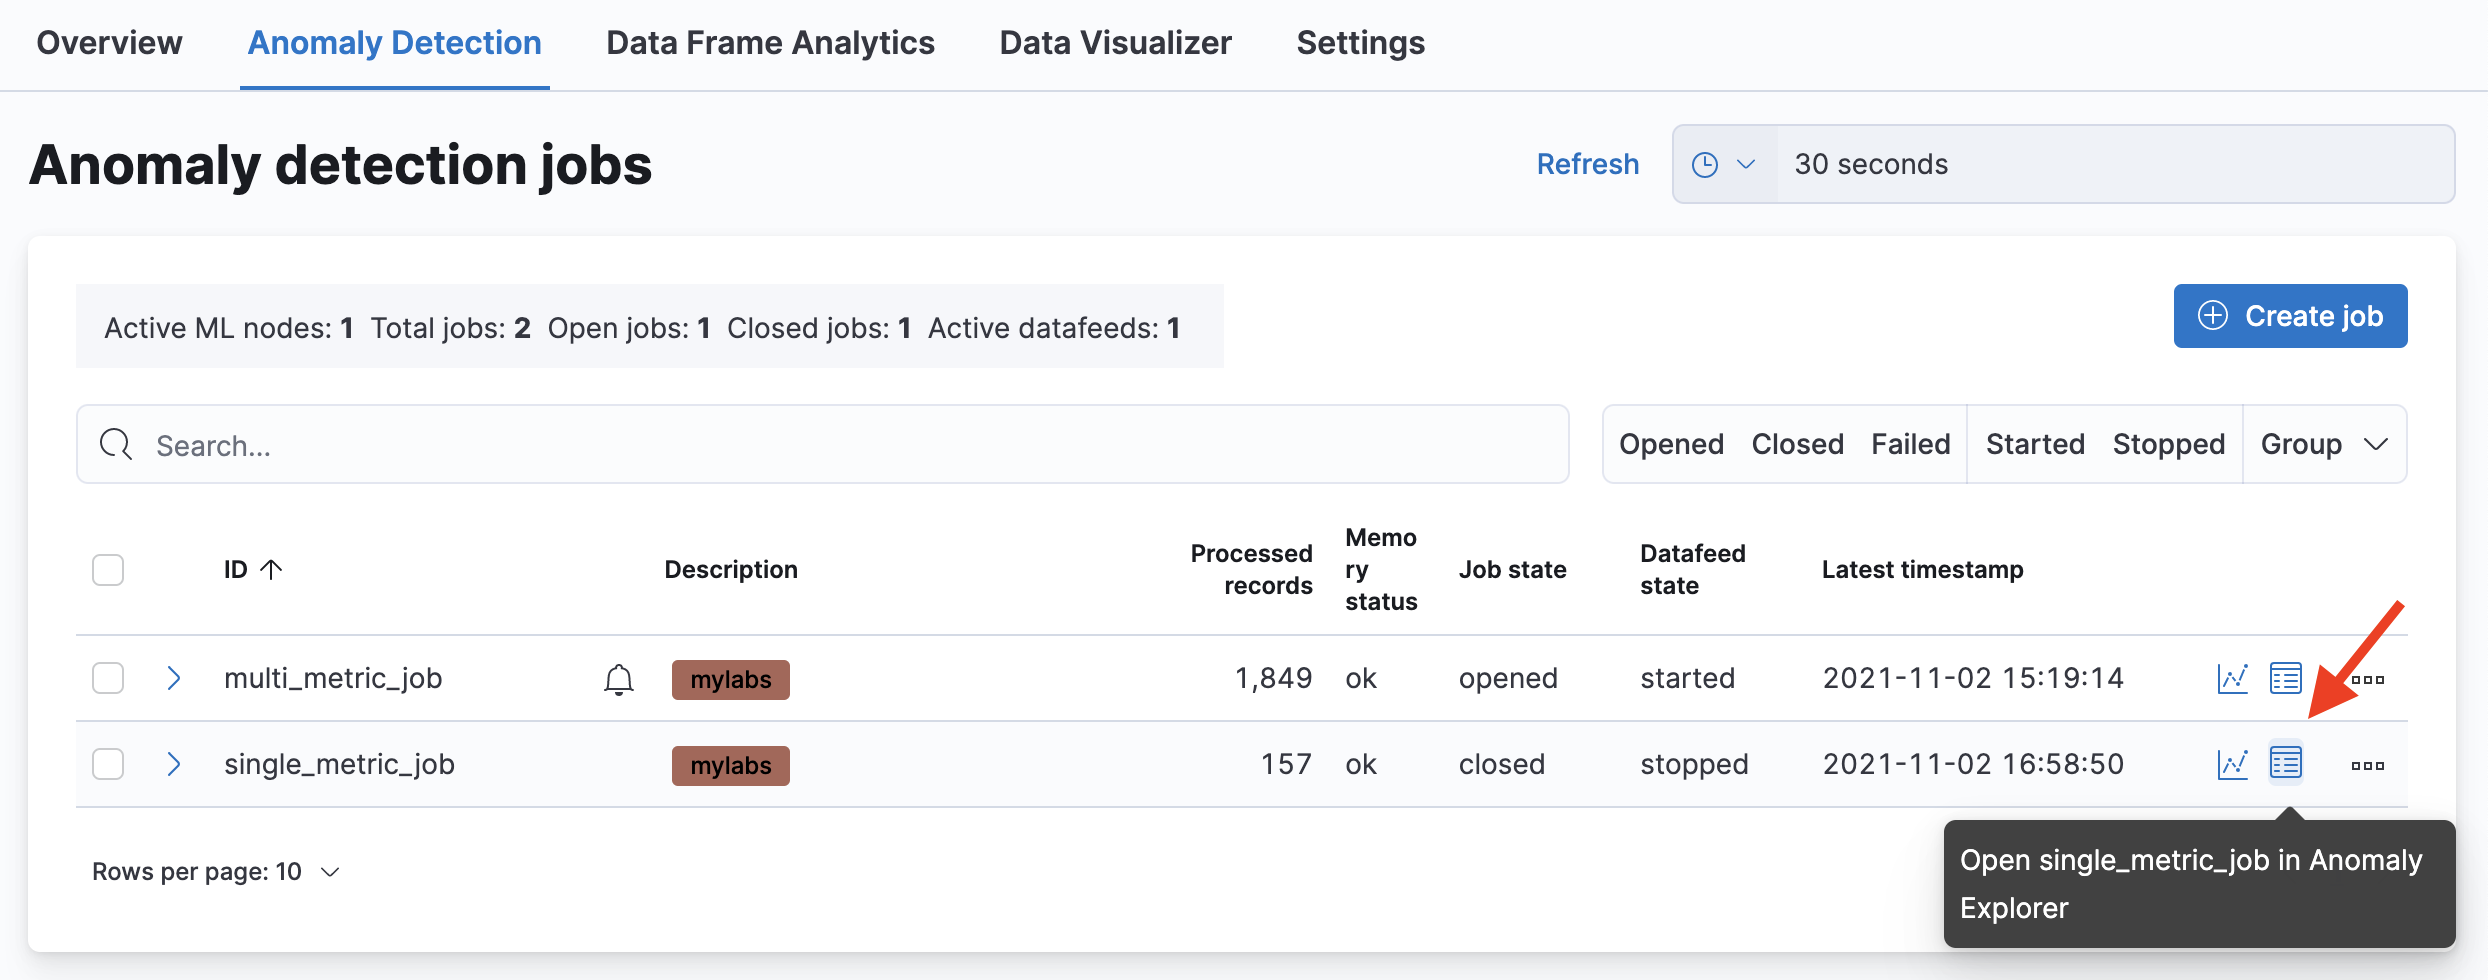
In the Machine Learning page, click on Jobs under the Anomaly Detection tab in the left side menu, to return to an overview of your jobs. -
Access the anomaly explorer for the single_metric_job by clicking the last icon in the row before the three dots:
-
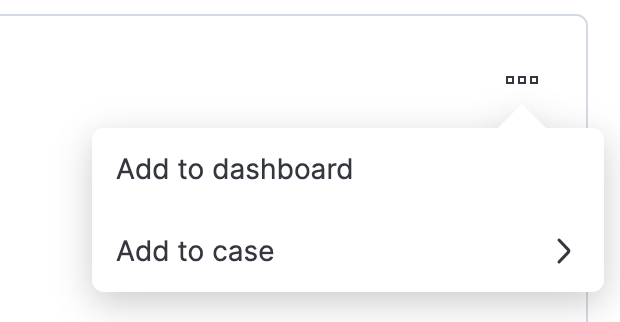
In the top right of the anomaly timeline, you will see three dots. Click those dots and select Add to dashboard.
-
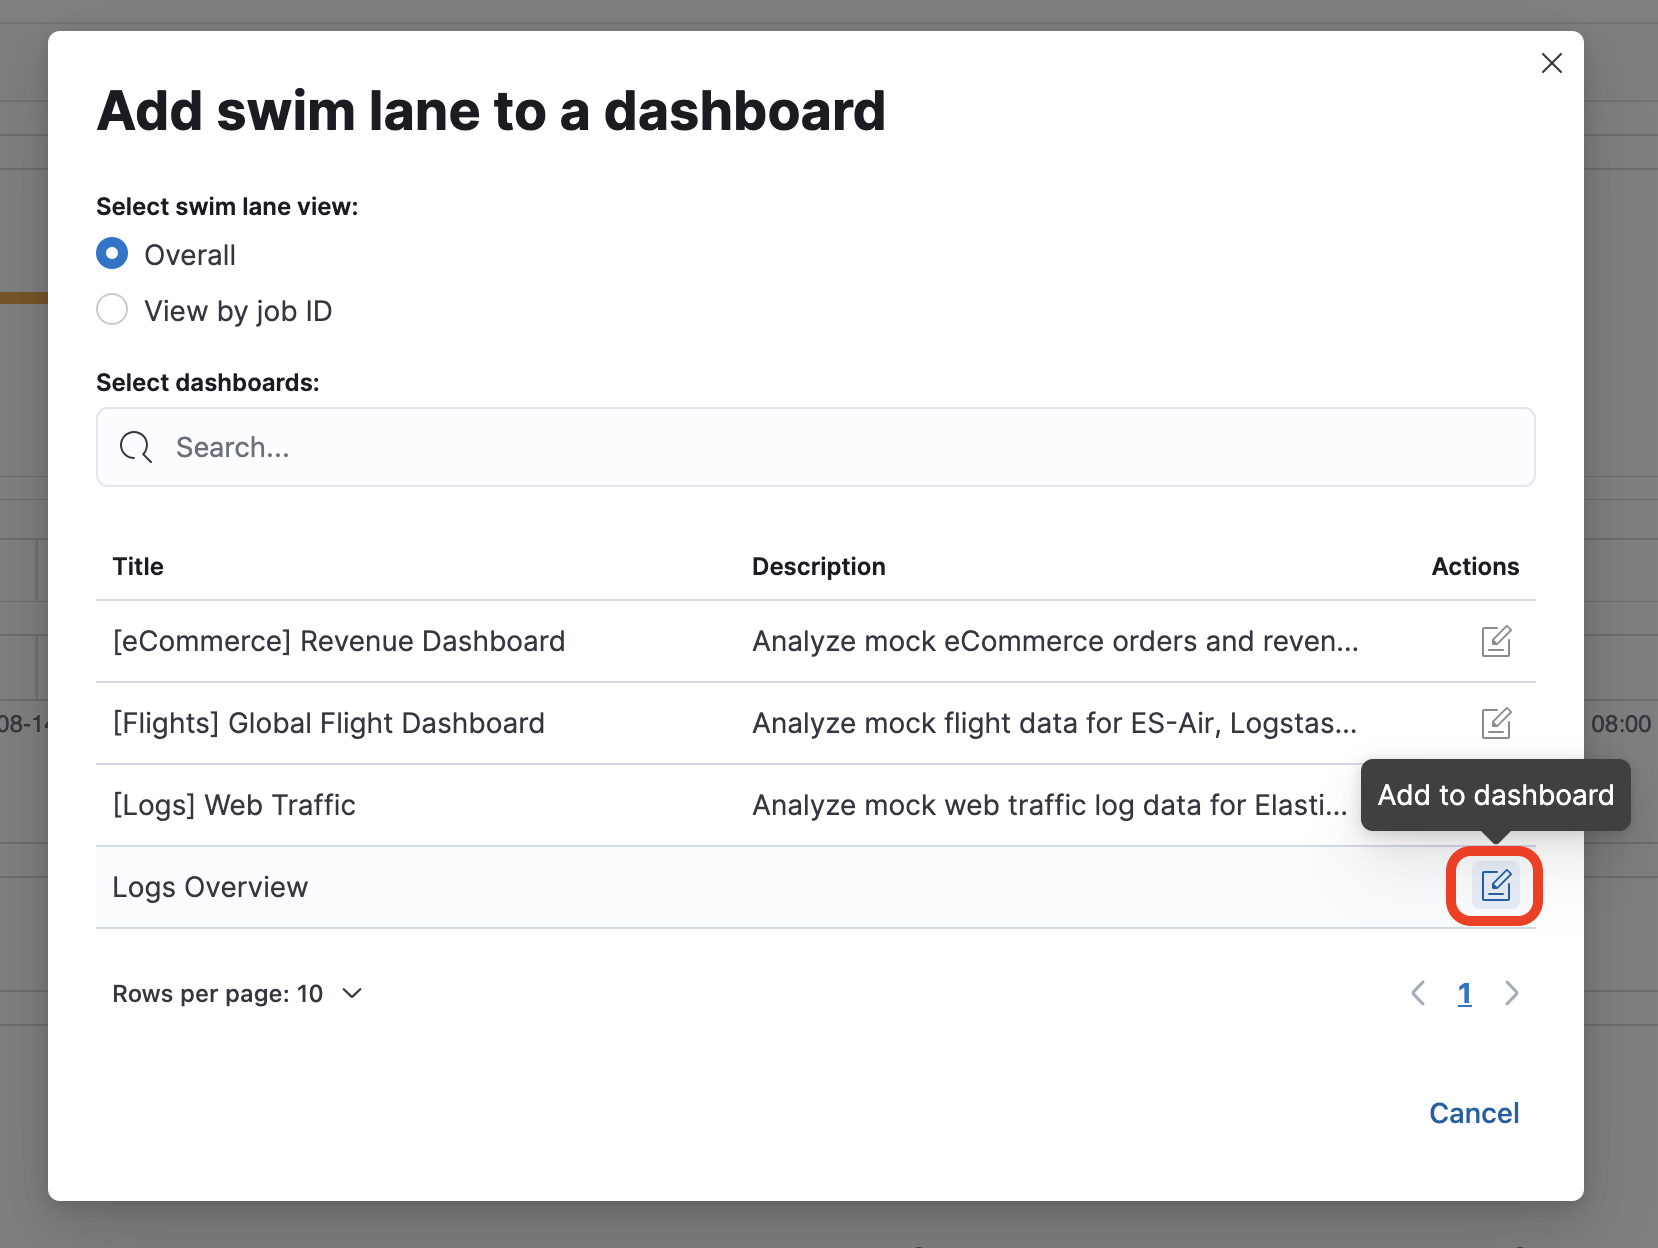
Select the dashboard you created earlier named Logs Overview, and click Add to dashboards.
-
You'll find the anomaly timeline at the bottom of the dashboard. You can resize and move it like any other panel.
-
Another way to add Machine Learning jobs to the dashboard is using the dashboard toolbar. Clicking on Select type You can add a chart by selecting Machine Learning > Anomaly chart, and then selecting your Machine Learning job.
-
Let's take a look at how you can work with the anomaly data. Open the Data view management panel by clicking on:
- > Stack Management > Kibana > Data views
- Save the dashboard
-
Click Create data view named
Anomaliesthat points to the.ml-anomalies-sharedindex pattern.
You will need to toggle Allow hidden and system indices via advanced settings as you create the index pattern.
Use@timestampas the timestamp field.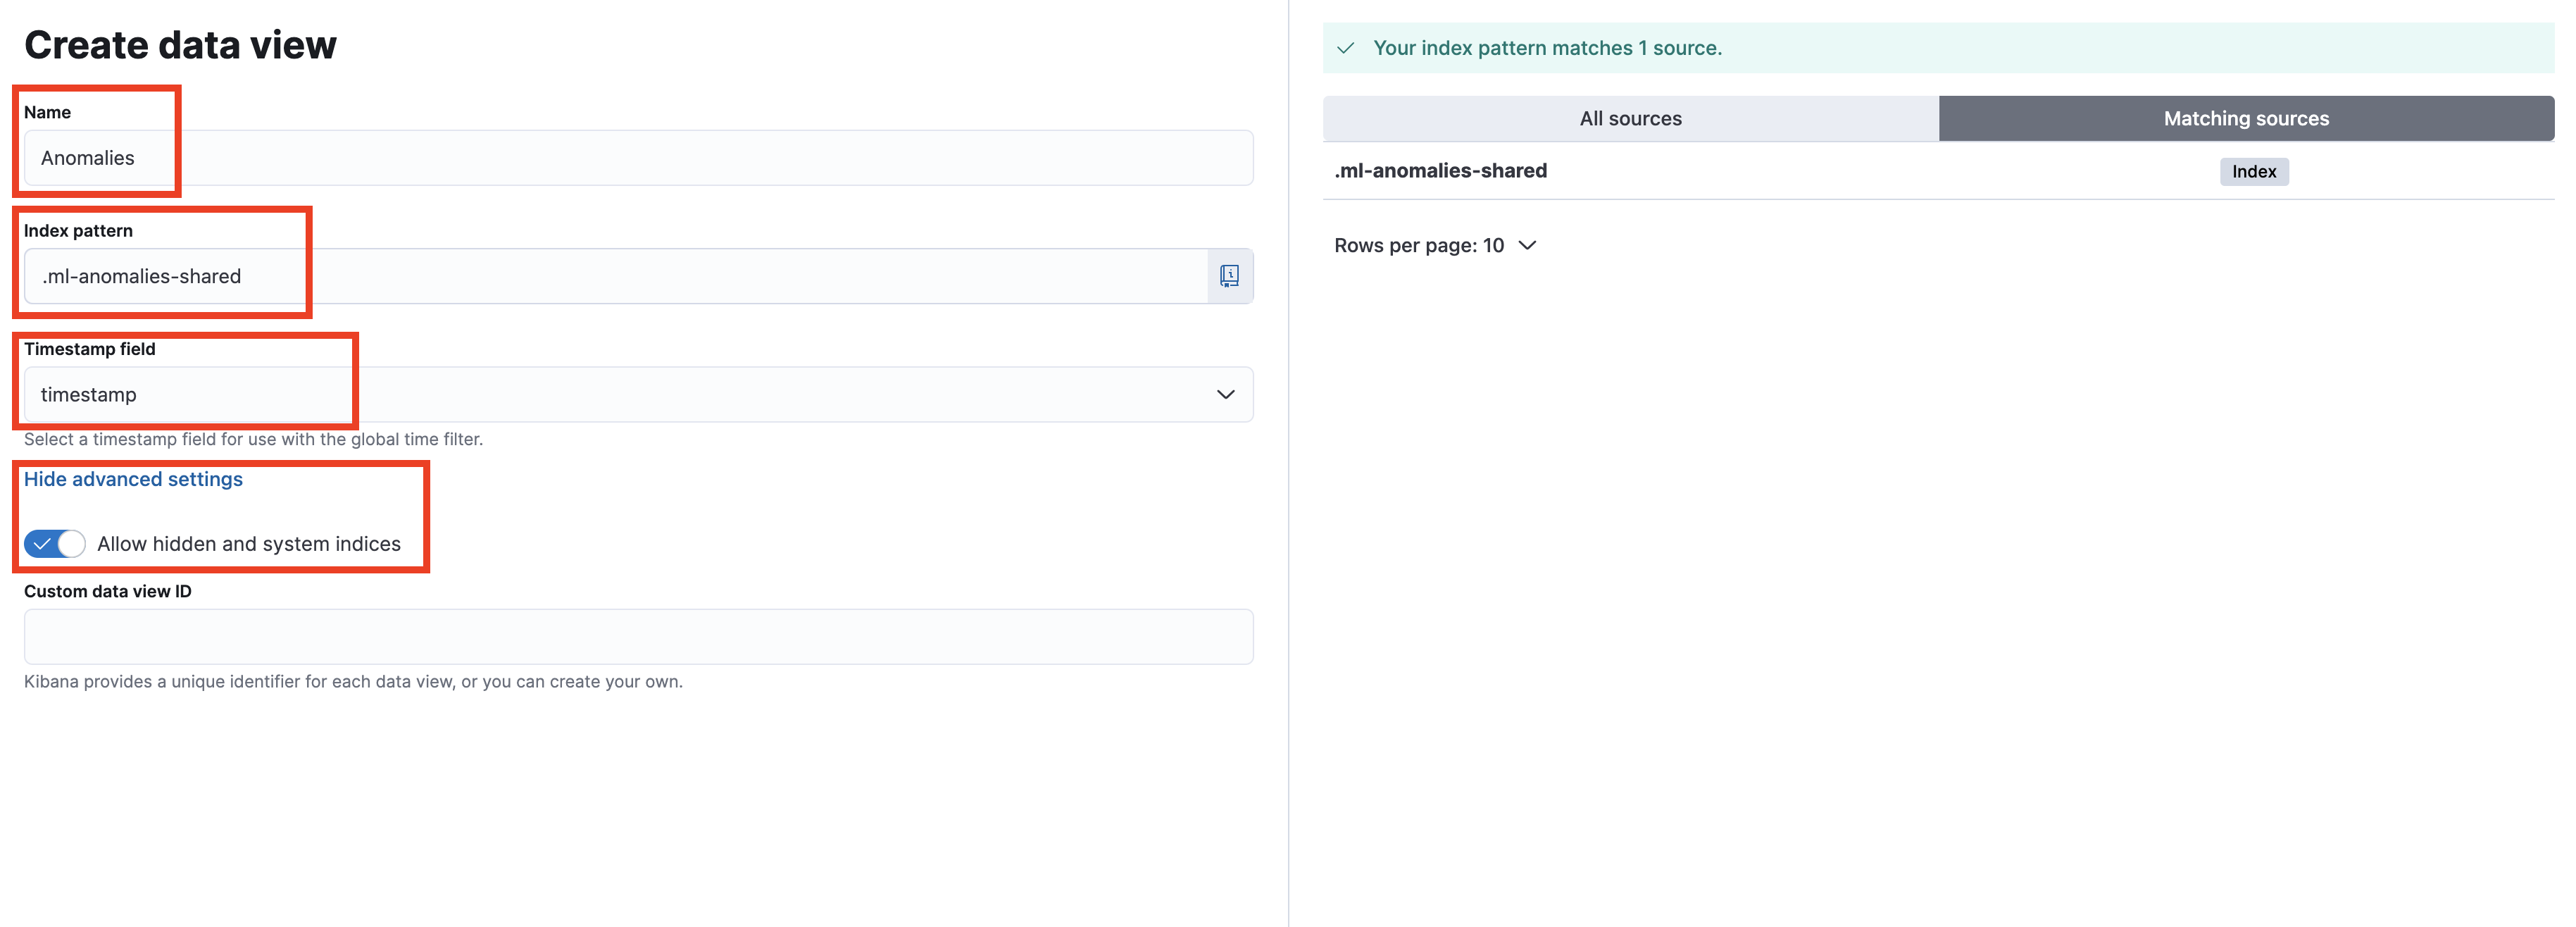
- Click Save data view to Kibana
-
Use the Discover interface to find out how many bucket-level minor anomalies (anomaly score higher than 25) have been detected so far. Use the query bar to perform your search. Use the help if you need.
Summary:
In this lab, you've learned how to use the results of machine learning jobs.