7.2: Runtime Fields
Objective:
In this lab, you will create, query, and visualize a runtime field.
-
In Kibana, open the Discover interface by clicking on:
- > Analytics > Discover
Make sure the Kibana Sample Data Logs data view is selected and time range is set to Last 7 days.
-
Let's say you want to know what day of the week is the busiest one, based on web server requests. Taking into consideration that the list of fields on the left does not have a day of the week field. What field could you use to derive the day of the week?
Show answer
The
@timestampfield. You can use a script to determine the day of the week for every timestamp. -
Let's add a runtime field that calculates the day of the week based on
@timestamp. Click on the Add a field button at the bottom of available fields list.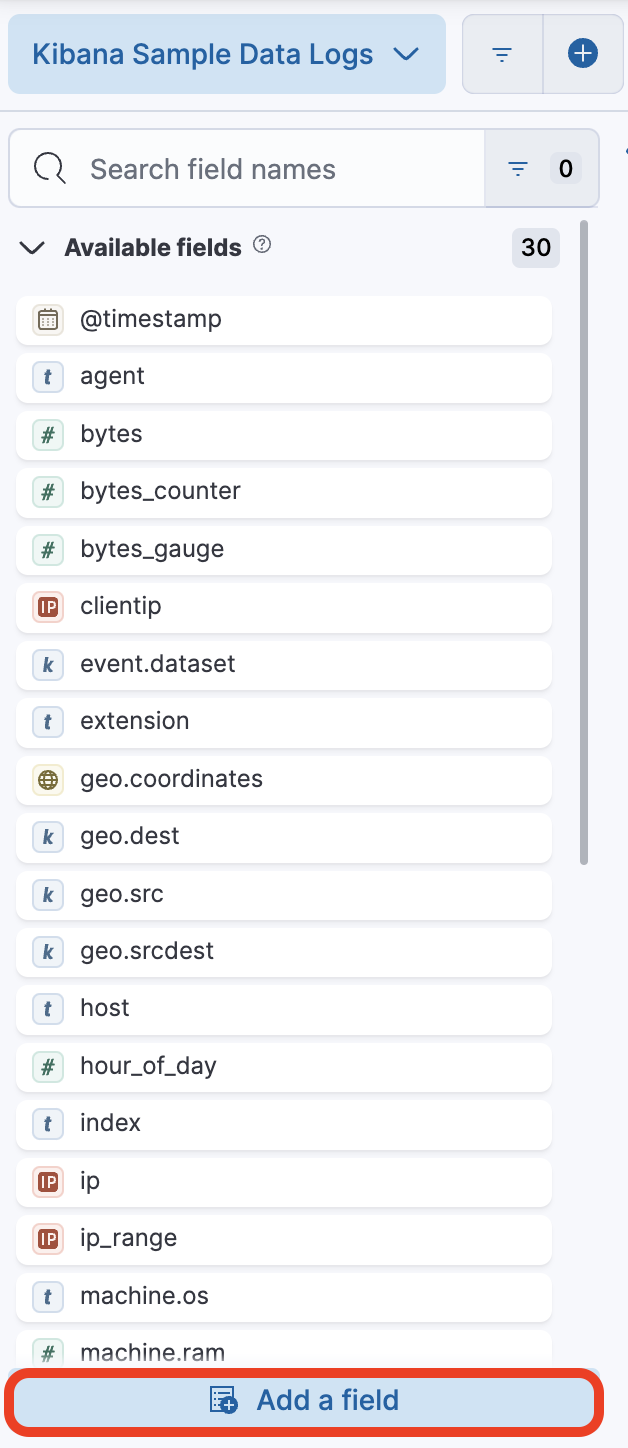
-
Build the "Create field" panel by entering the follwing information:
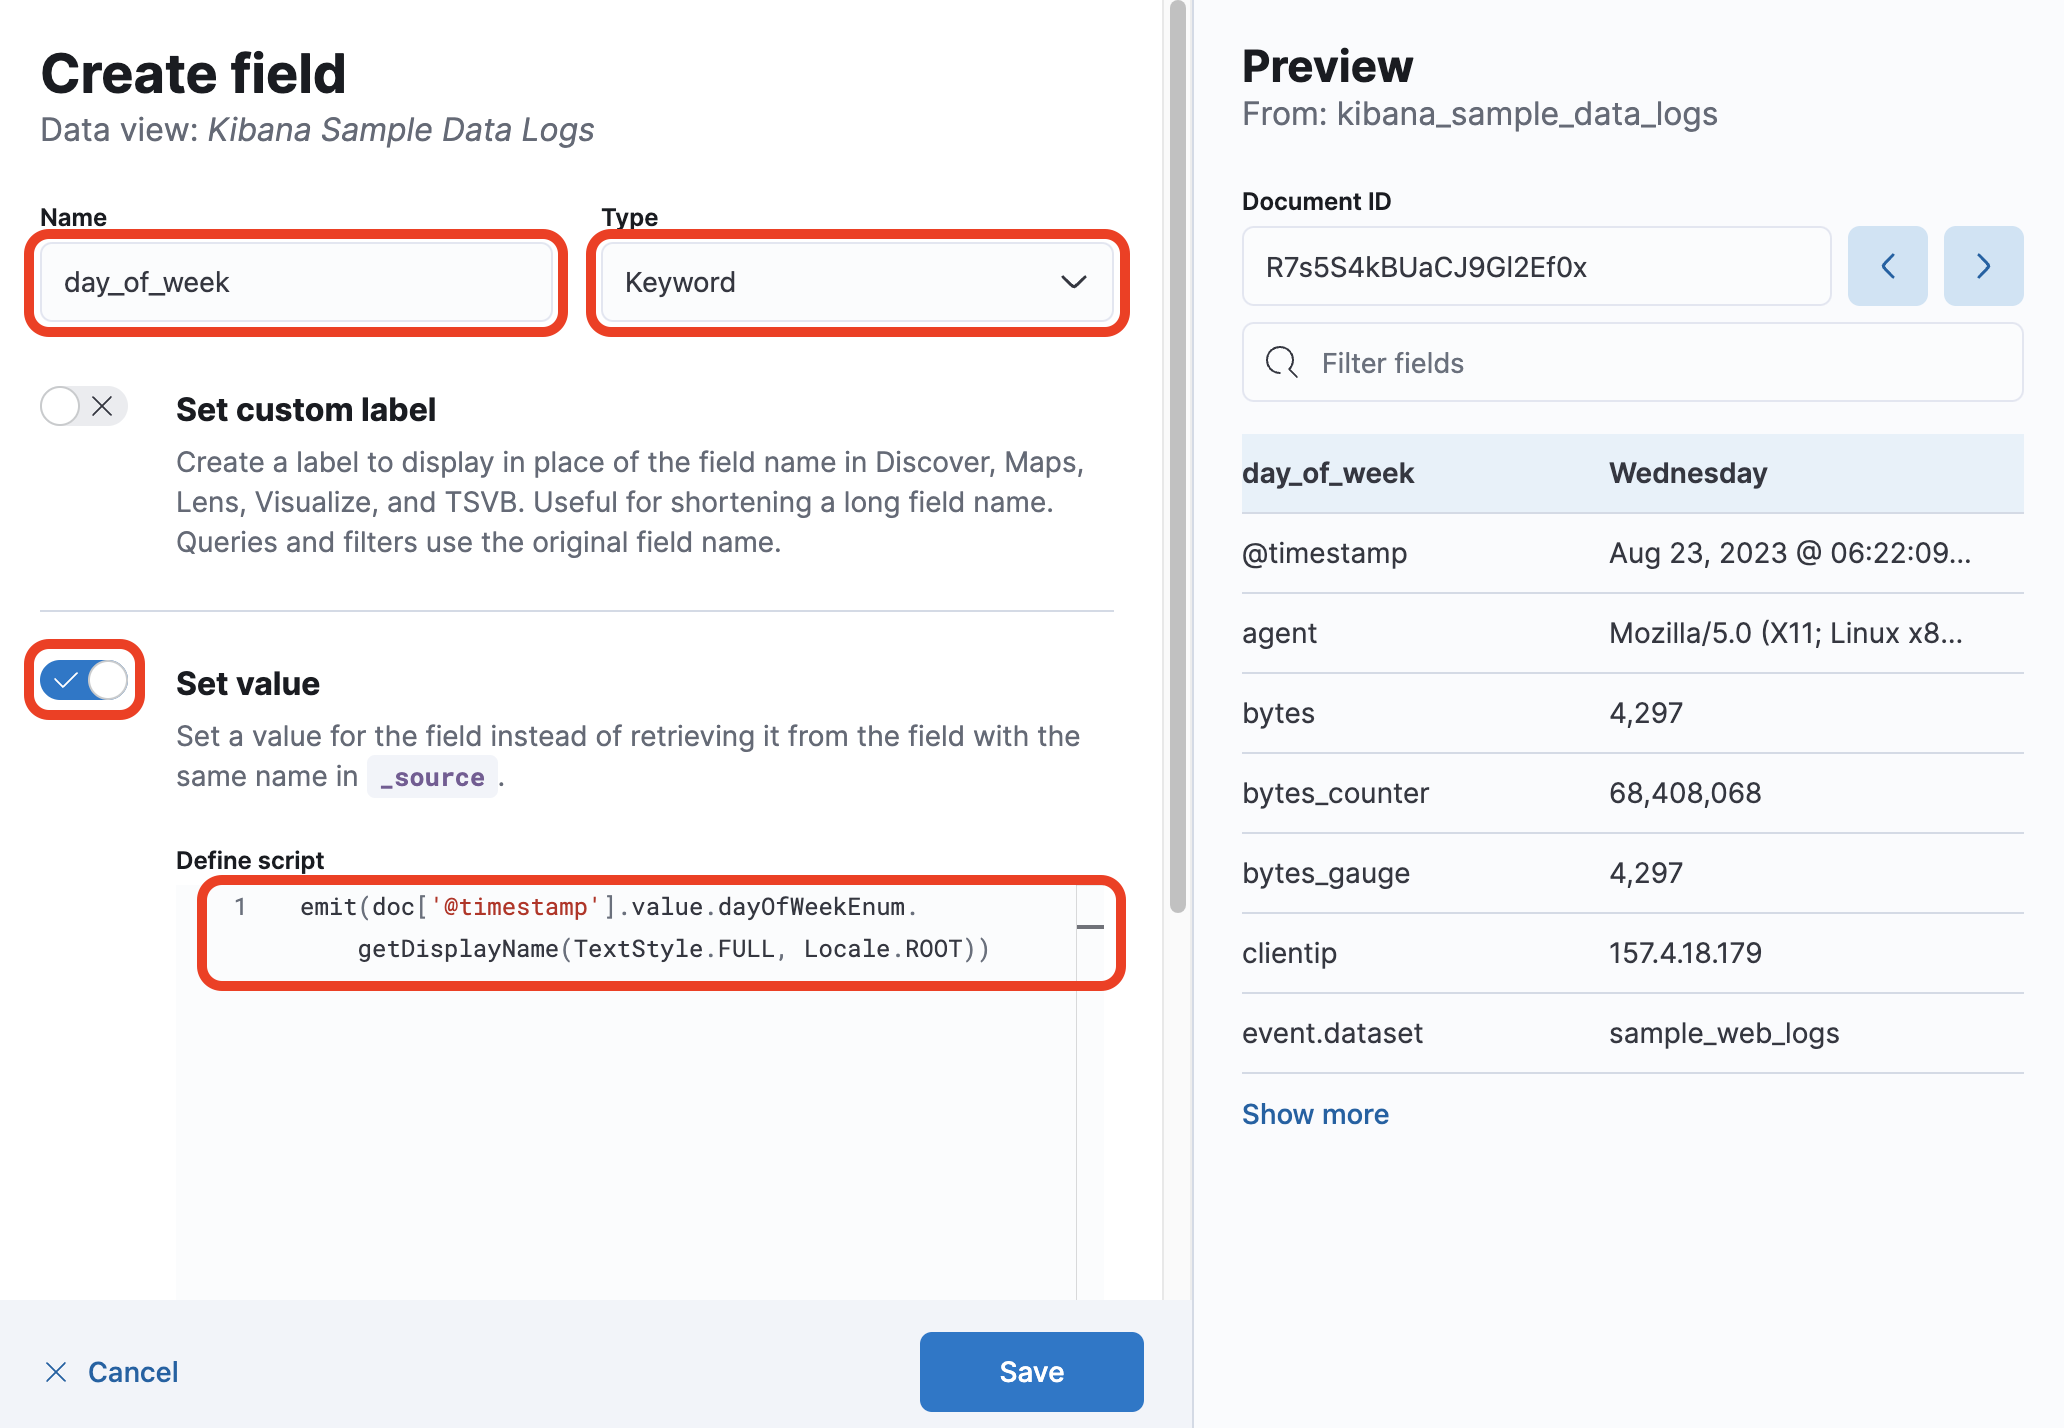
- Name the field
day_of_weekand keep Keyword selected as the type. - Toggle Set value.
- Use the following Painless script in the Define script field:
NOTE: The right preview shows the resulting day_of_week runtime field results for a random document. You can use the left and right arrows to scroll through multiple documents.
- Name the field
-
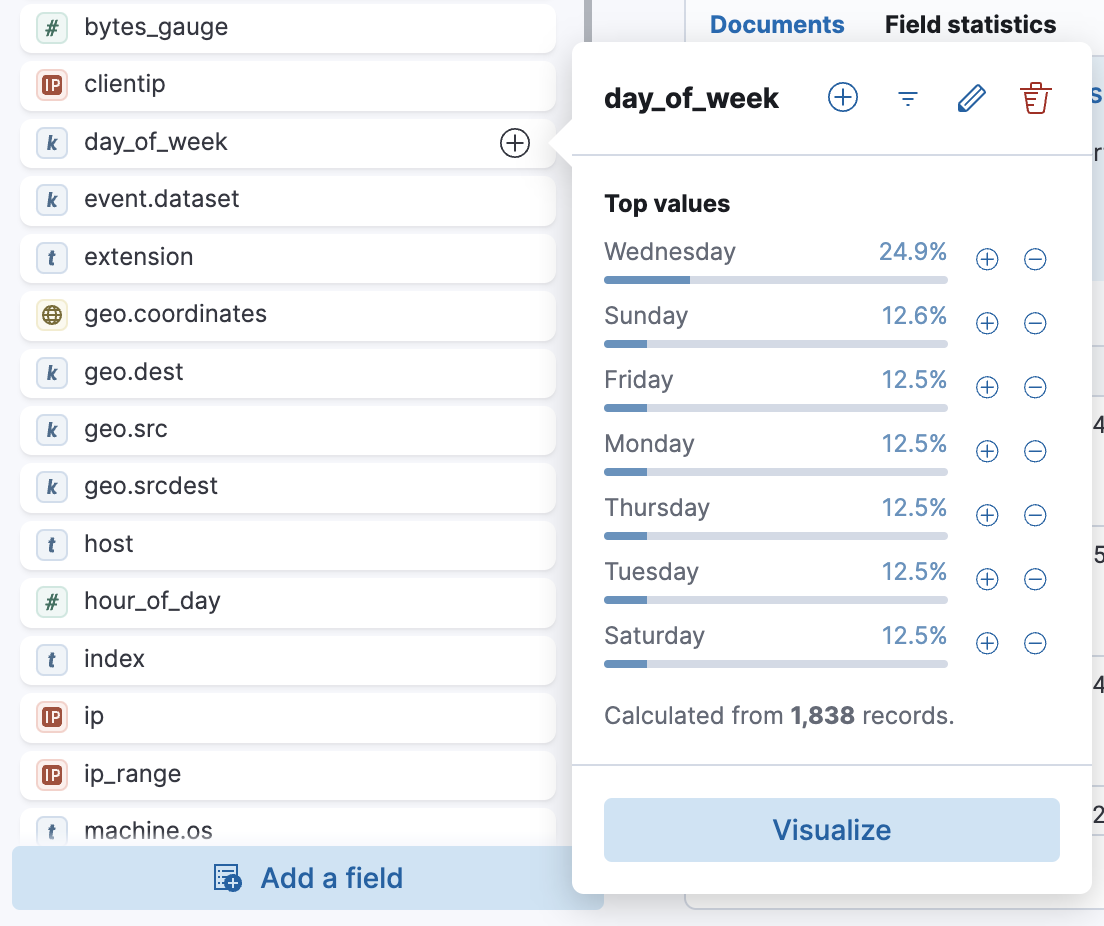
Click Save and you should now see a new day_of_week field in the available fields list.
-
Click the day_of_week field and you should see a list of most common values.
-
Query the sample log data for requests that happened on a Monday.
Show answer
Runtime fields can be queried like any other field. You can use the following query:
day_of_week:MondayNote the date histogram now only shows data from Monday. -
Open your Logs Overview dashboard, switch to edit mode if necessary, and create a new visualization.
-
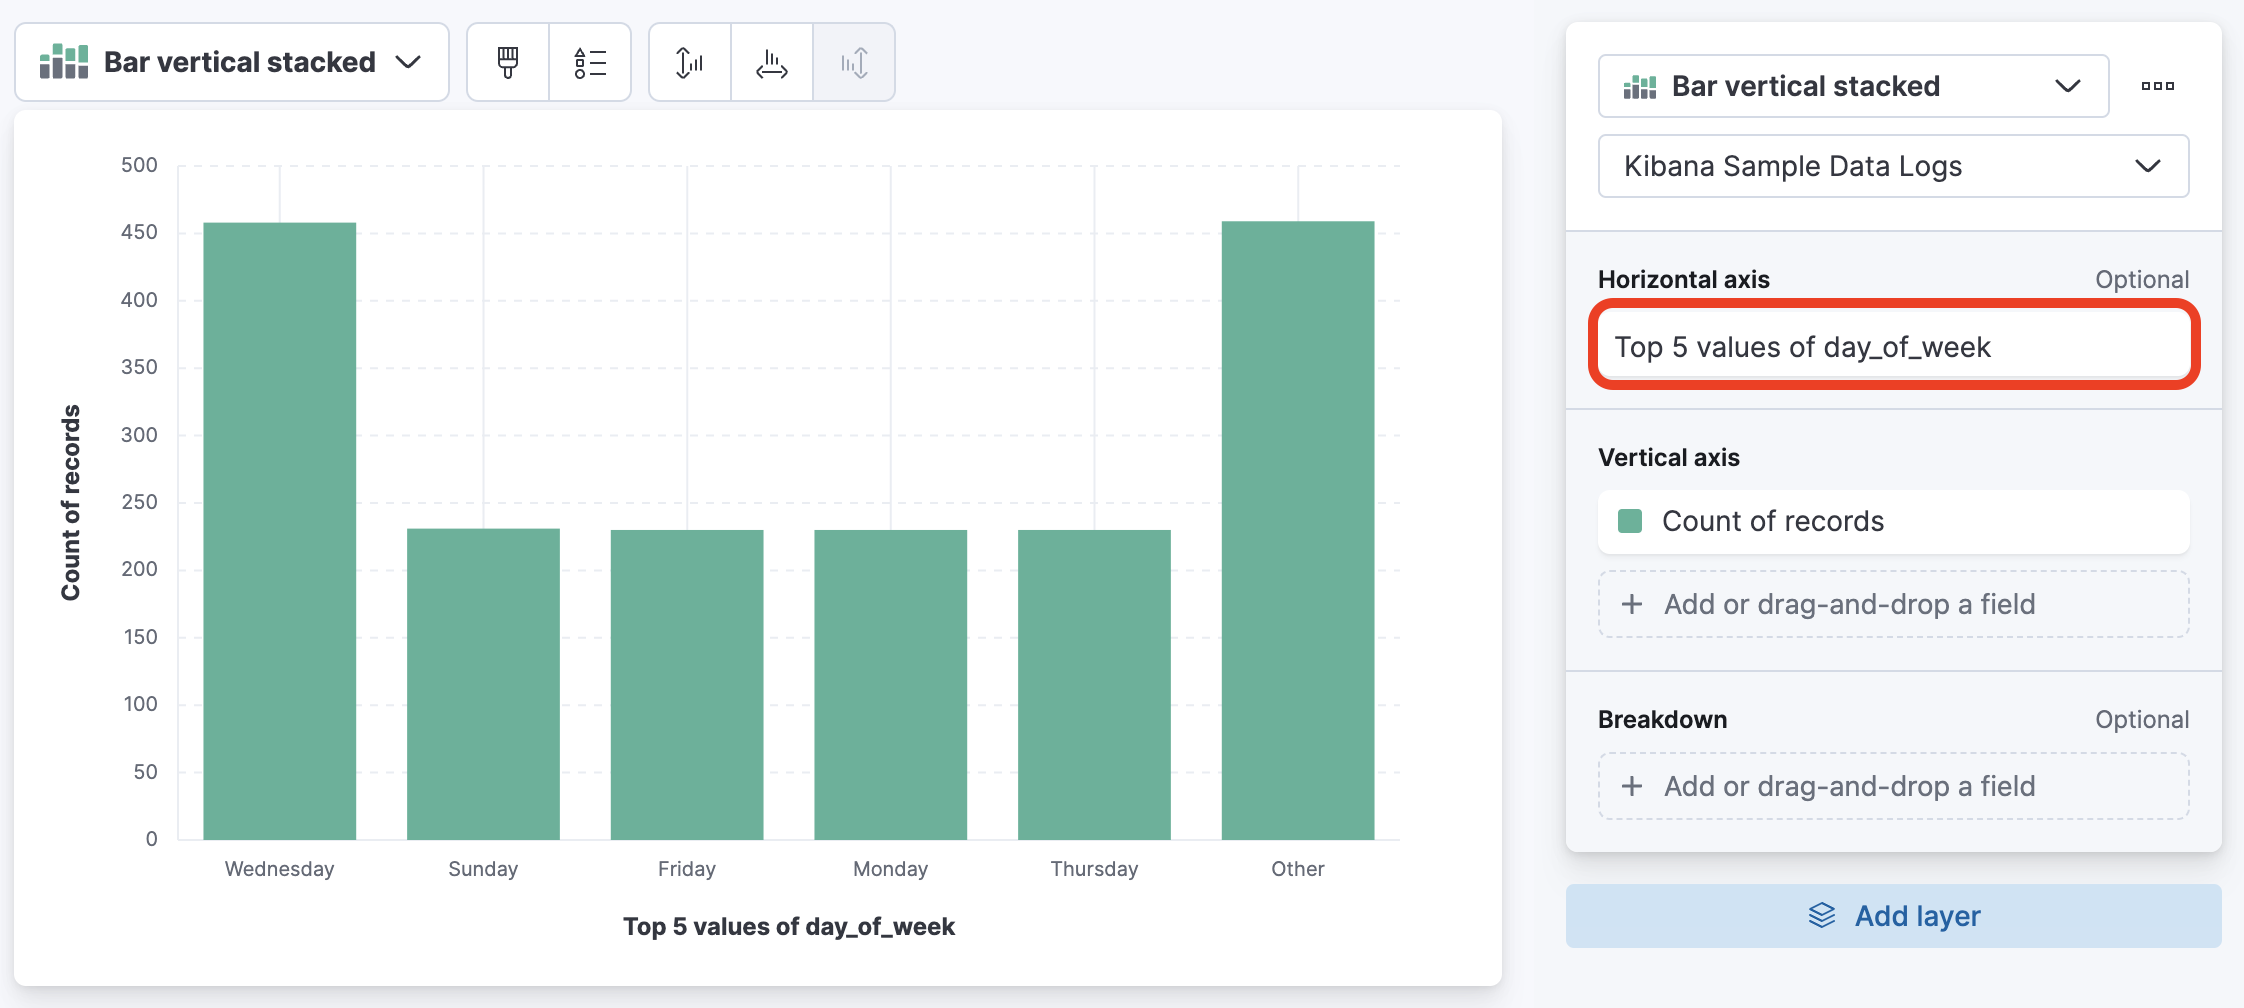
The new day_of_week runtime field is listed in the available fields list, so drag the day_of_week field on to the workspace.
-
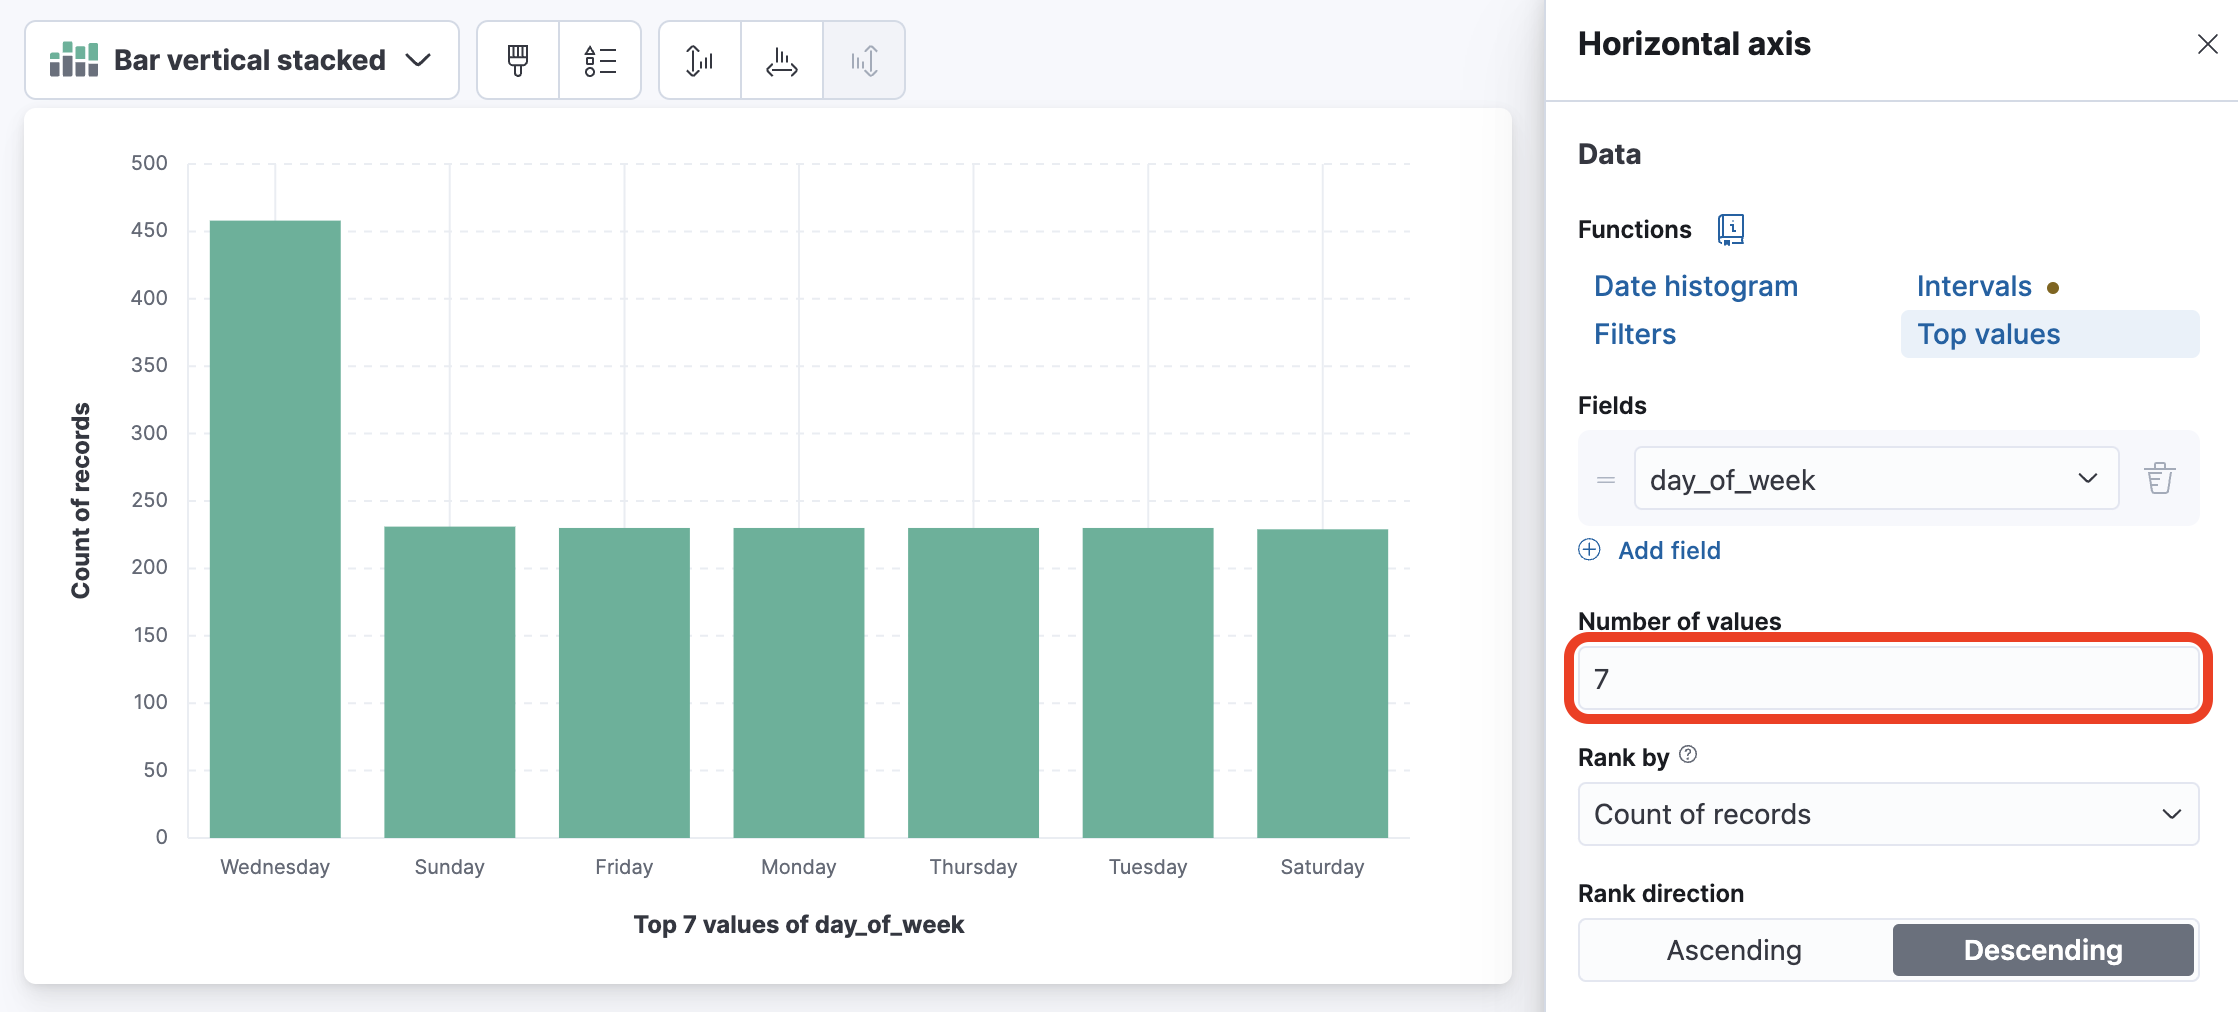
Click Top 5 values of day_of_week on the right.
-
Change Number of values to
7.
-
Click Save and return to add the visualization to your dashboard. Next, save the dashboard.
Summary:
In this lab, you created, queried, and visualized a runtime field.